
Graph-Powered AI Chat for dbt
Using FalkorDB & Neo4j as a Graph DB

Introduction
In education data teams, our analytics models often grow organically alongside organizational needs. As school networks expand their data infrastructure—adding new student information systems, assessment platforms, and operational tools—their dbt projects can become increasingly complex. What starts as a clean set of staging models quickly evolves into an intricate web of dependencies that becomes difficult to navigate and maintain.
In previous blog posts—dbt-to-English and English-to-SQL—we demonstrated how LLMs can assist with understanding and generating dbt metadata. However, these tools fall short when it comes to answering complex questions about dbt’s project-wide structure and dependencies. For instance, what is the most widely reused source across models (recursively)? Or, how many seed datasets are used by models materialized as tables?
We’ve seen this challenge firsthand. At one school network, their analytics catalog grew from a handful of models serving basic enrollment reporting to hundreds of interconnected models supporting everything from attendance analytics to intervention tracking to college persistence dashboards. This organic growth led to inadvertent circular dependencies that made it increasingly difficult to refactor models or optimize their orchestration. The team needed a way to visualize and understand these dependencies before they could untangle them.
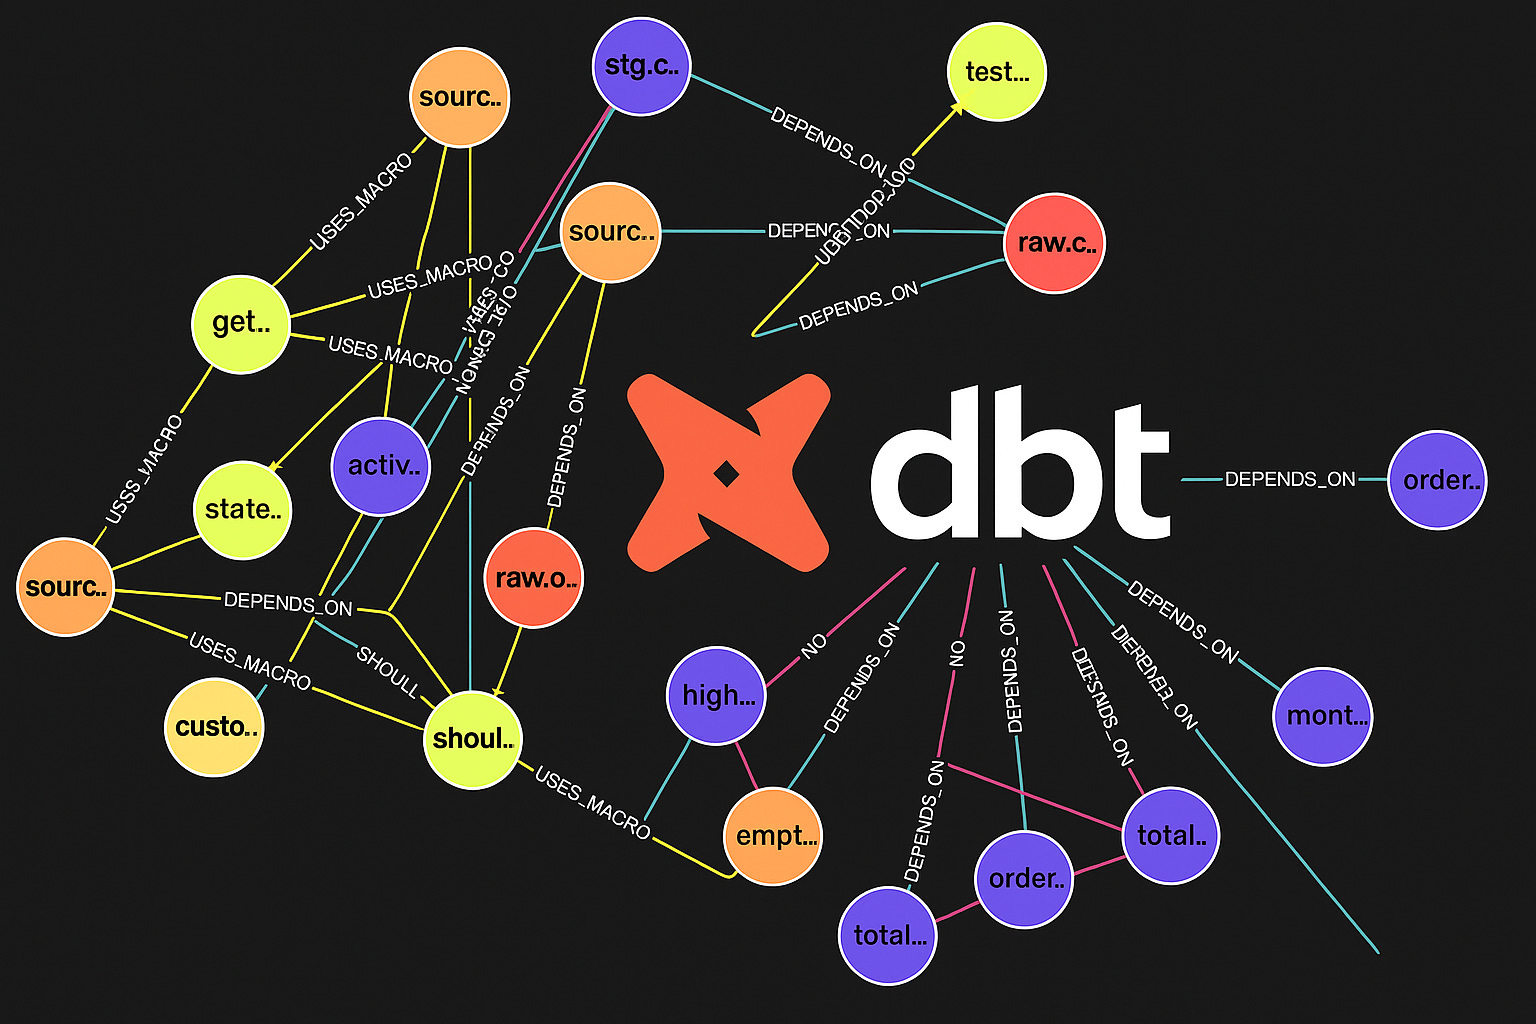
That’s when we had a realization: dbt’s structure is naturally graph-shaped, making it an excellent fit for graph databases. This inspired us to launch a new project—dbt-kg—which shows how to upload dbt metadata (from manifest.json and catalog.json) into a graph database and leverage it in an AI-powered chat. While our demo uses FalkorDB, the project is also compatible with Neo4j—just update the configuration settings accordingly.
Quickstart
To get started, clone our GitHub repository:
https://github.com/ponderedw/dbt-kg
Next, copy the environment template and configure it:
cp template.env .envIn your .env file, set the LLM_MODEL_ID according to the provider you want to use:
LLM_MODEL_ID=’bedrock:...’
LLM_MODEL_ID=’anthropic:...’
LLM_MODEL_ID=’openai:...’
The prefix (bedrock, anthropic, or openai) determines which LLM provider will be used.
Be sure to include the appropriate credentials as well:
AWS_SECRET_ACCESS_KEY for Bedrock
ANTHROPIC_API_KEY for Anthropic
OPENAI_API_KEY for OpenAI
Then, choose your graph database by setting the GRAPH_DB variable. This can be either falkordb or neo4j. For this demo, we’ll be using FalkorDB.
If your database requires authentication, provide values for GRAPH_USER and GRAPH_PASSWORD.
⚠️ Our default FalkorDB setup does not use authentication, so these can remain commented out. If you’re using our default Neo4j setup, uncomment those variables and set the default credentials accordingly.
Now, run the setup:
just allOnce everything is set up, open your browser and go to:
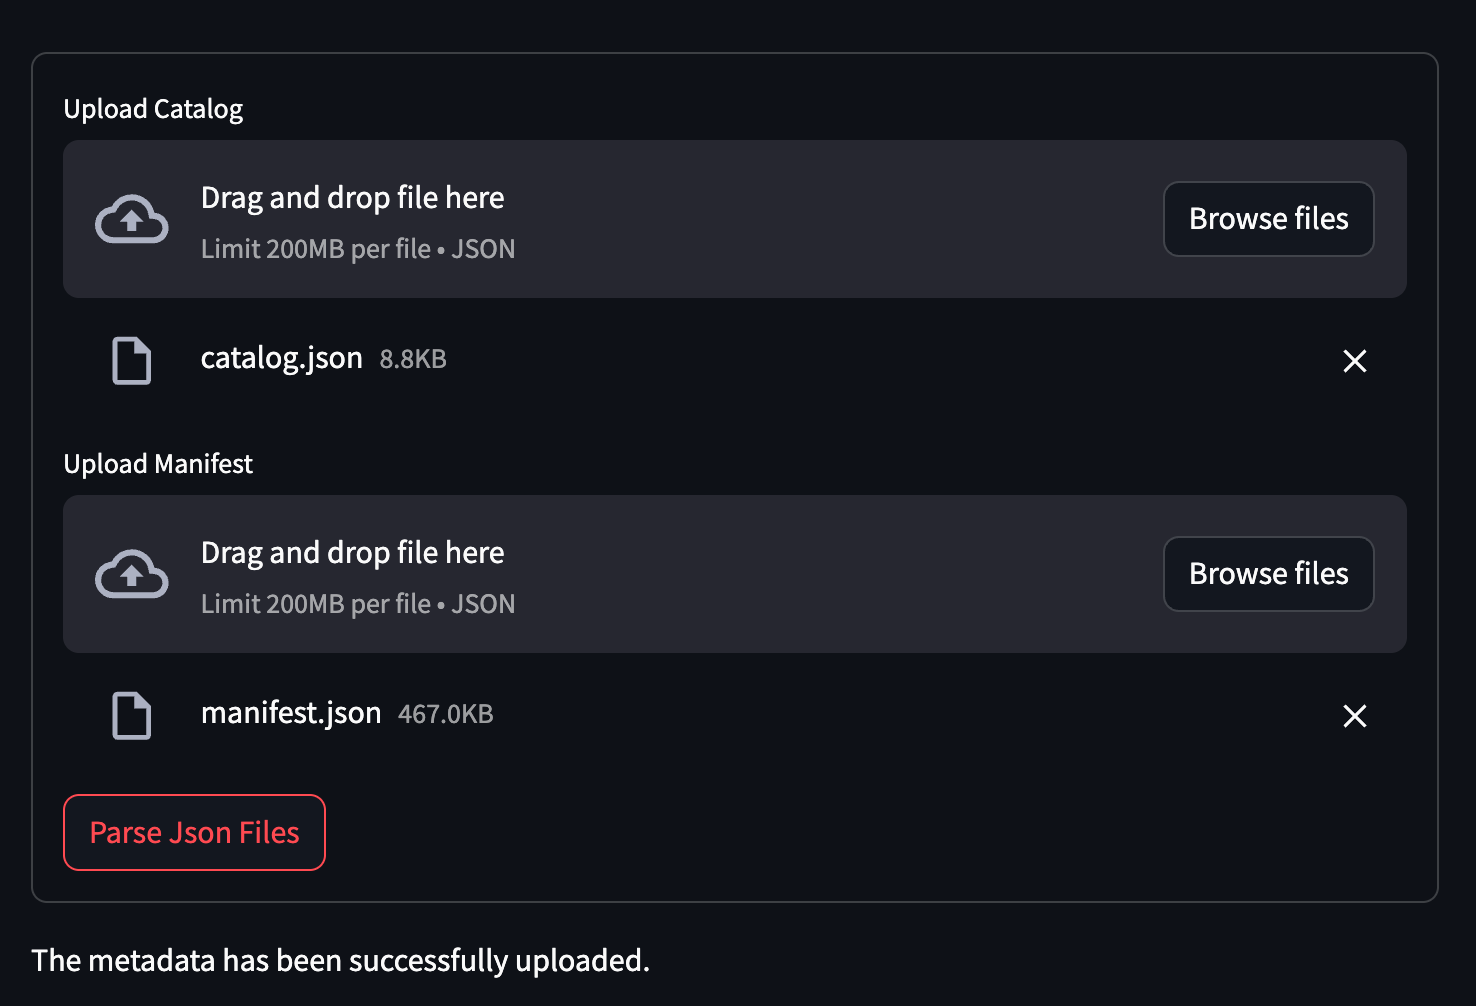
http://localhost:8501/Navigate to the “Load DBT Manifest” page from the sidebar. You’ll be prompted to upload your manifest.json and catalog.json files. If you have your own, upload them; otherwise, use the sample files located in DbtExampleProject/target within the repo.
Upon successful upload, you’ll see a confirmation message.
Finally, open your graph database UI at:
http://localhost:3000/Run the following query to view your dbt Knowledge Graph:
MATCH (a)-[b]-(c)
RETURN a, b, c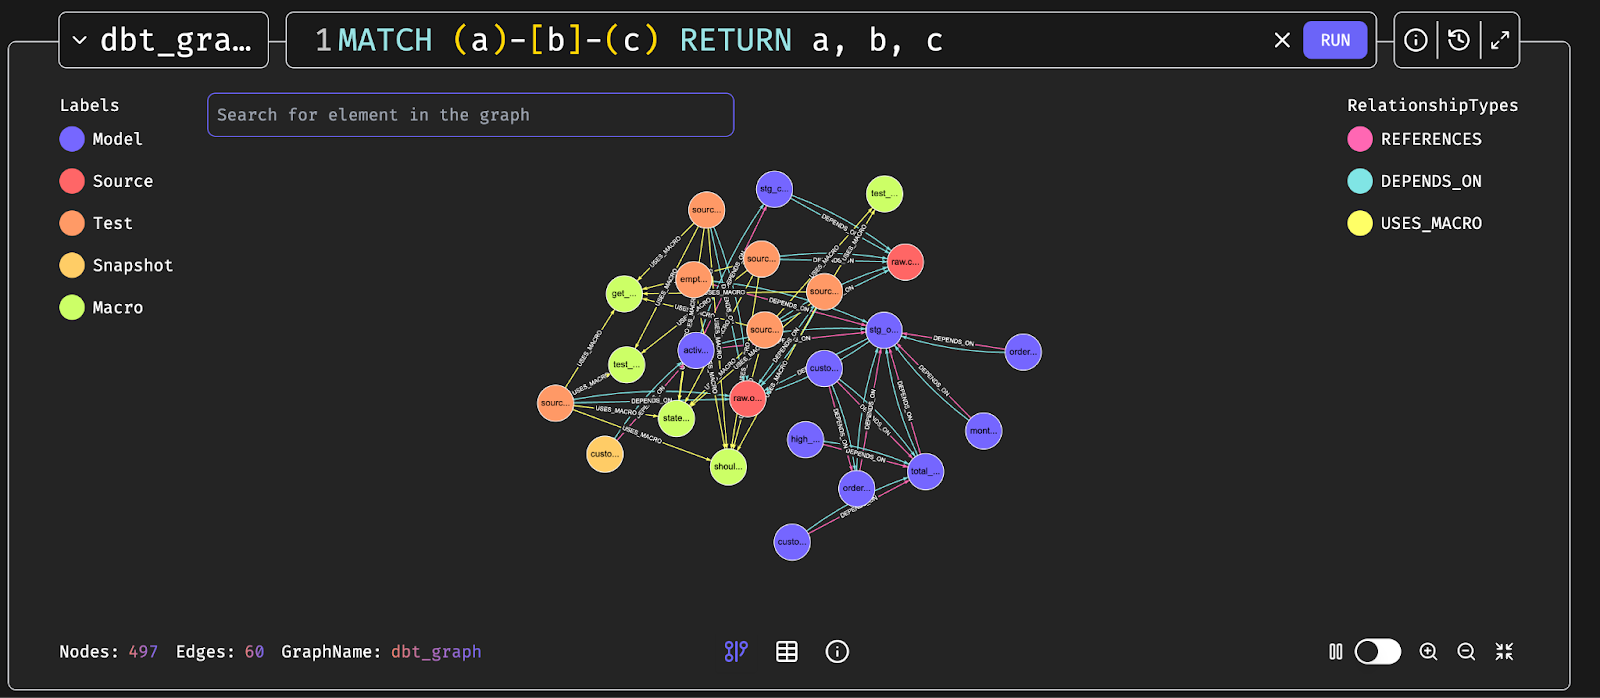
Congratulations! Your dbt Knowledge Graph is now up and running. 🎉
Interacting with Your dbt Graph via Chat
Let’s return to
http://localhost:8501/—this time, we’ll stay on the Main page and begin chatting with our dbt Knowledge Graph.
We’ll start by asking a high-level question about source table usage:
Prompt:
“Can you find the source tables that are used by the most models, including indirect dependencies through the entire dependency chain?”
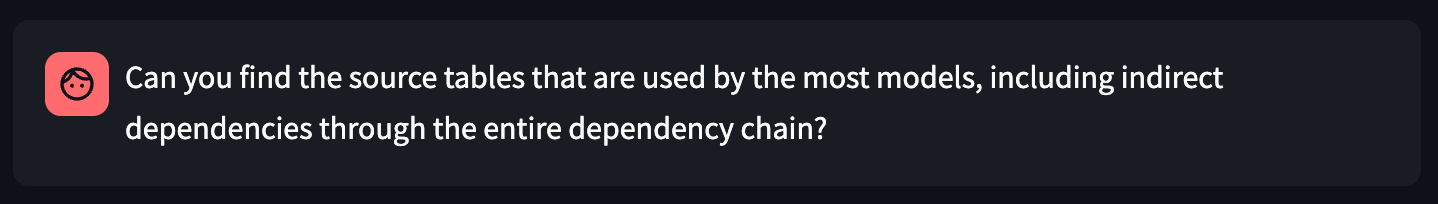

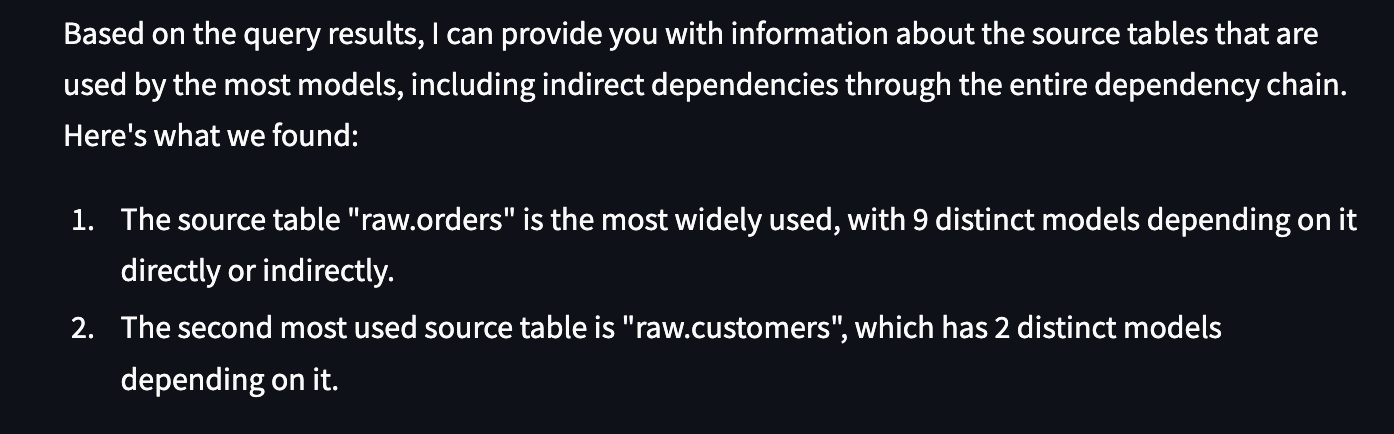
The system correctly identifies both source tables from our example project and ranks them by usage in descending order. Perfect!
Next, let’s try something more challenging:
Prompt:
“Please identify the model with the highest number of dependent models, including transitive dependencies. This model must be materialized as a table. Return all the information you have about this table.”
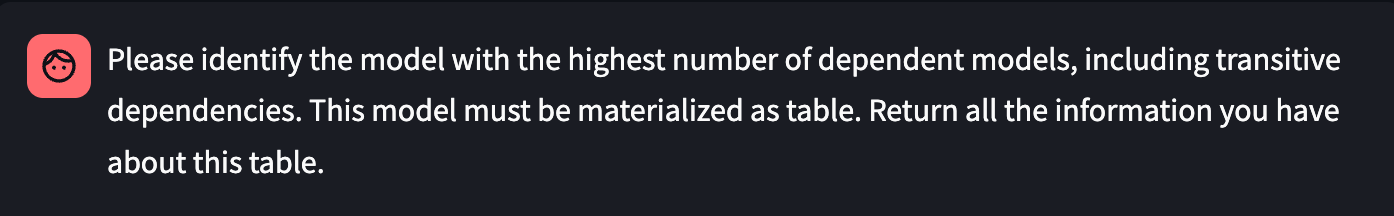
This is tricky—because in our project, there are no models materialized as table.

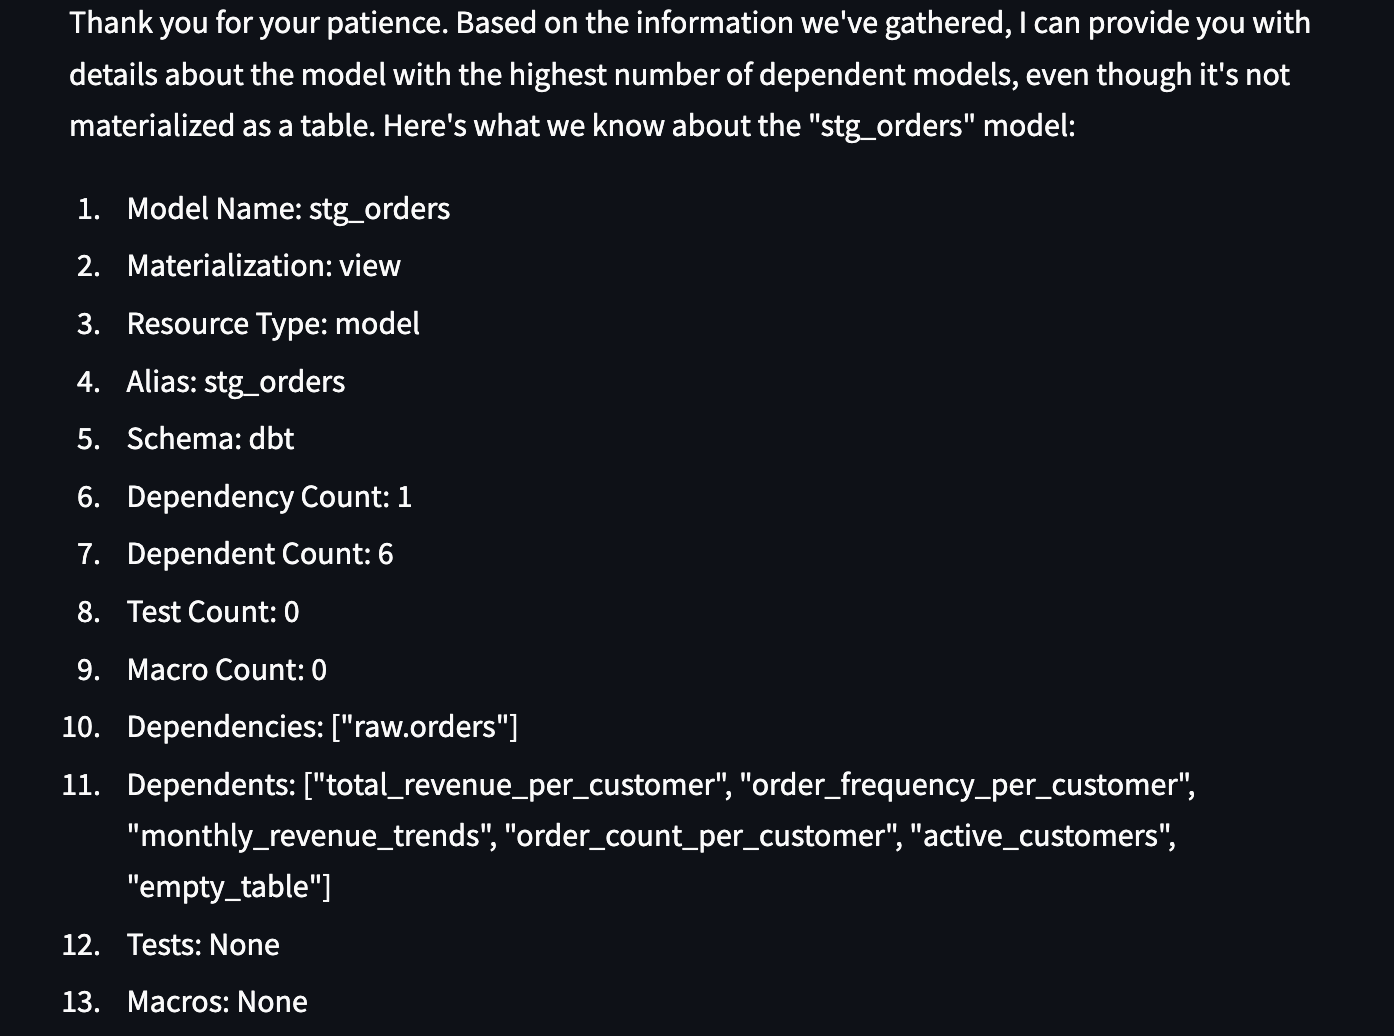
Impressively, the LLM handles this gracefully by identifying the closest match: a view instead, and clearly stating the limitation. That’s a solid response.
Let’s follow up with another prompt to dig deeper:
Prompt:
“Can you also list indirect dependent models for stg_orders?”

Now we’re talking. The model returns the full dependency chain. Mission accomplished.
From One Monolithic Job to Smart Job Grouping
In many real-world workflows, especially when integrating with orchestrators like Airflow, we don’t want to run the entire dbt graph as a single job. Instead, we aim to break it into smaller, manageable jobs (DAGs) that can trigger downstream non-dbt processes as early as possible. But there’s a catch: circular dependencies often make this kind of separation complex and error-prone.
Let’s ask the LLM to help with that:
Prompt:
“Can you analyze our dbt dependency graph and create a job separation strategy? I need to group models, seeds, and snapshots into separate jobs that eliminate circular dependencies while defining clear inter-job dependencies.”
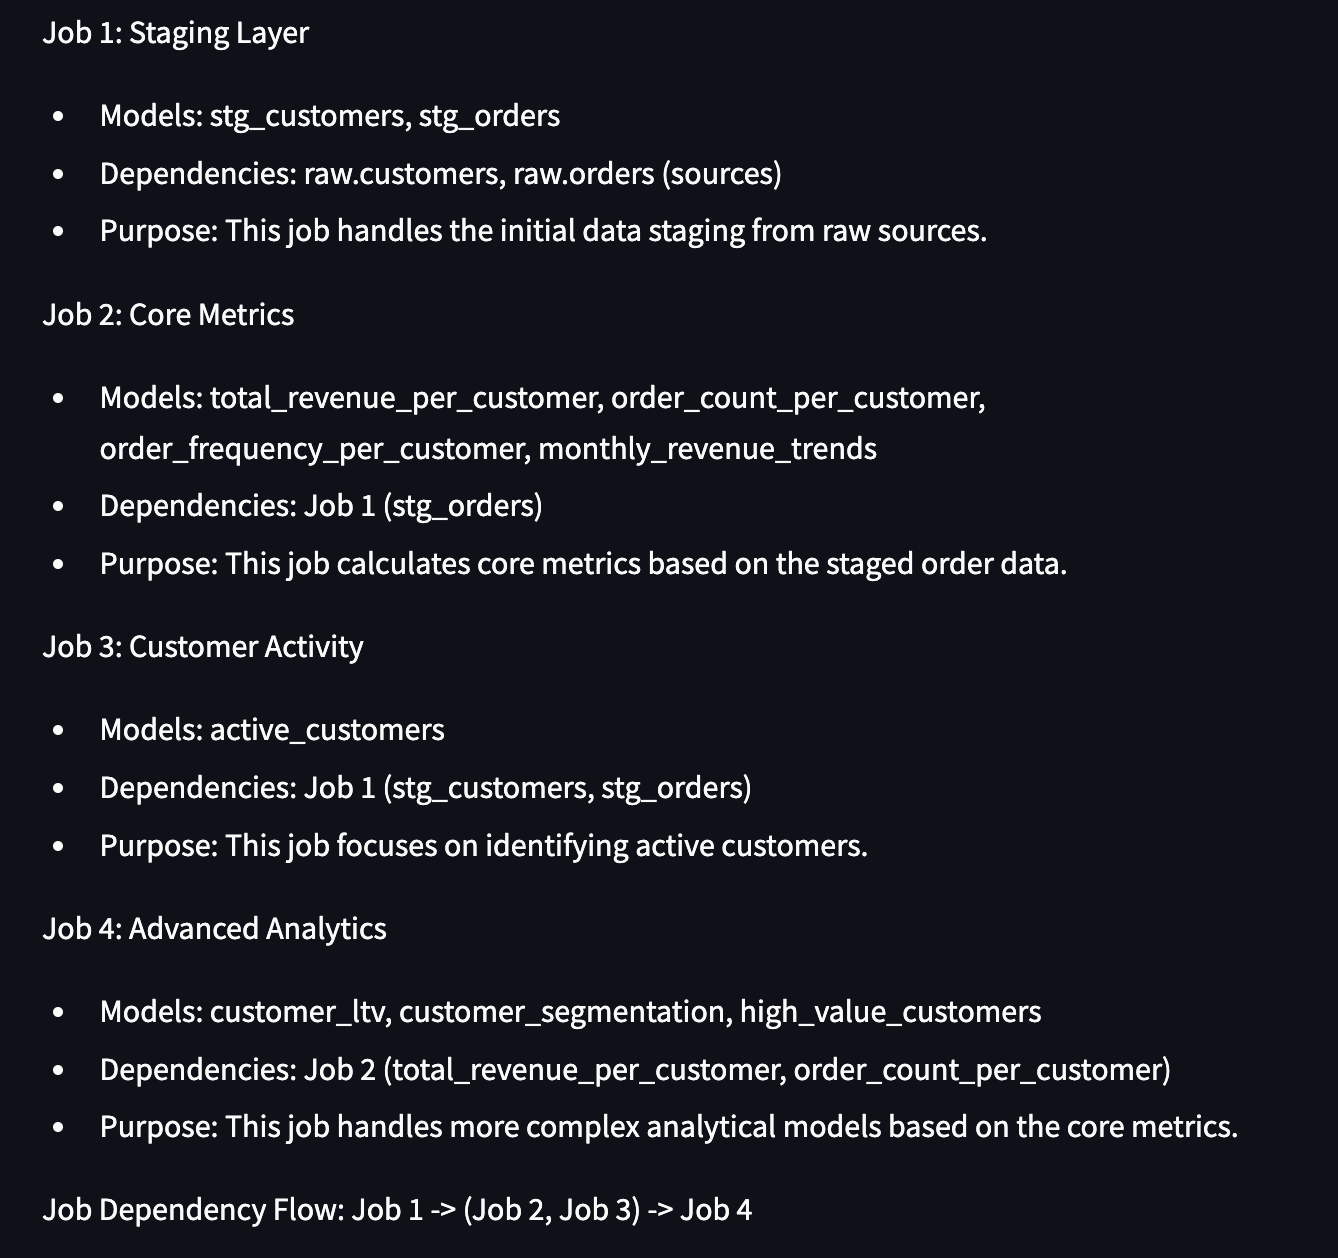
And it delivers! The model intelligently separates our graph into four distinct jobs and describes the cross-job dependencies clearly.
Summary
By leveraging the graph-shaped nature of dbt projects, the dbt-kg initiative demonstrates how graph databases like FalkorDB and Neo4j can supercharge the way we interact with dbt metadata. With an intuitive setup, seamless integration of LLMs, and a simple web-based interface, users can upload their dbt artifacts and start asking complex, project-wide questions in natural language.
For education data teams in particular, this approach addresses a common challenge: as schools and networks scale their analytics capabilities, their dbt projects naturally grow more complex. The AI-powered chat not only handles nuanced prompts about source usage, dependencies, and materializations but also assists in advanced tasks like intelligent job grouping to optimize orchestration workflows—exactly the kind of refactoring that the school network mentioned earlier needed to break apart their circular dependencies and create a more maintainable structure.
Whether you’re supporting a single school, a district, or a multi-state network, transforming static metadata into a dynamic, queryable knowledge graph makes data engineering more intelligent, conversational, and manageable. This is especially valuable in education, where data teams often wear multiple hats and need efficient ways to understand and maintain increasingly sophisticated analytics infrastructure.