

Introduction
A few weeks ago we wrote about upgrading the dbt AI stack with FalkorDB, vector embeddings, full-text search, and Bedrock reranking. It works well — semantic queries, concept-based discovery, multi-layer retrieval all in one system. But it also requires a running graph database, an embeddings pipeline, and cloud infrastructure before you get your first answer.
That’s the right setup for a production data platform. It’s too much for most situations.
graphify — built by Safi — is a tool we use constantly for the lighter cases. Point it at any folder of code or docs, and it extracts a knowledge graph you can query in plain English: graphify query "what calls this function?", graphify path "AuthModule" "Database", graphify explain "SwinTransformer". It runs locally, needs no API key for code projects, and integrates directly into Claude Code as a skill. On most repos it gives an AI agent a navigable map of the codebase instead of making it read files one at a time. Our Airflow repo is a good example — it's mostly Python and heavily functional, and graphify's call-graph queries make sense of it in a way that grepping DAG files never quite does.
dbt projects are the exception. Run graphify on a dbt project and you get a broken graph. The problem is Jinja2: dbt SQL isn’t standard SQL — it’s a template language where dependencies are expressed as {{ ref('stg_orders') }} and {{ source('raw', 'orders') }}. graphify’s extractor sees those as opaque macro calls, not edges. The lineage it produces is incomplete at best; usually it’s just a bag of disconnected SQL files with no meaningful relationships between them. dbt’s layer semantics — source → staging → intermediate → mart — don’t exist in the output at all. The result costs more tokens to query than just grepping the files.
Ask an agent “what breaks if I change stg_students?” and it has to read every .sql file in the project, reason over raw text, and hope it doesn’t miss an indirect dependency. On a 200-model project, that burns more tokens than it saves.
The thing is, dbt already computed the answer. Every dbt compile or dbt parse writes the fully-resolved DAG to target/manifest.json — every node, every edge, every upstream and downstream relationship, fully materialized. It’s sitting there in your target directory.
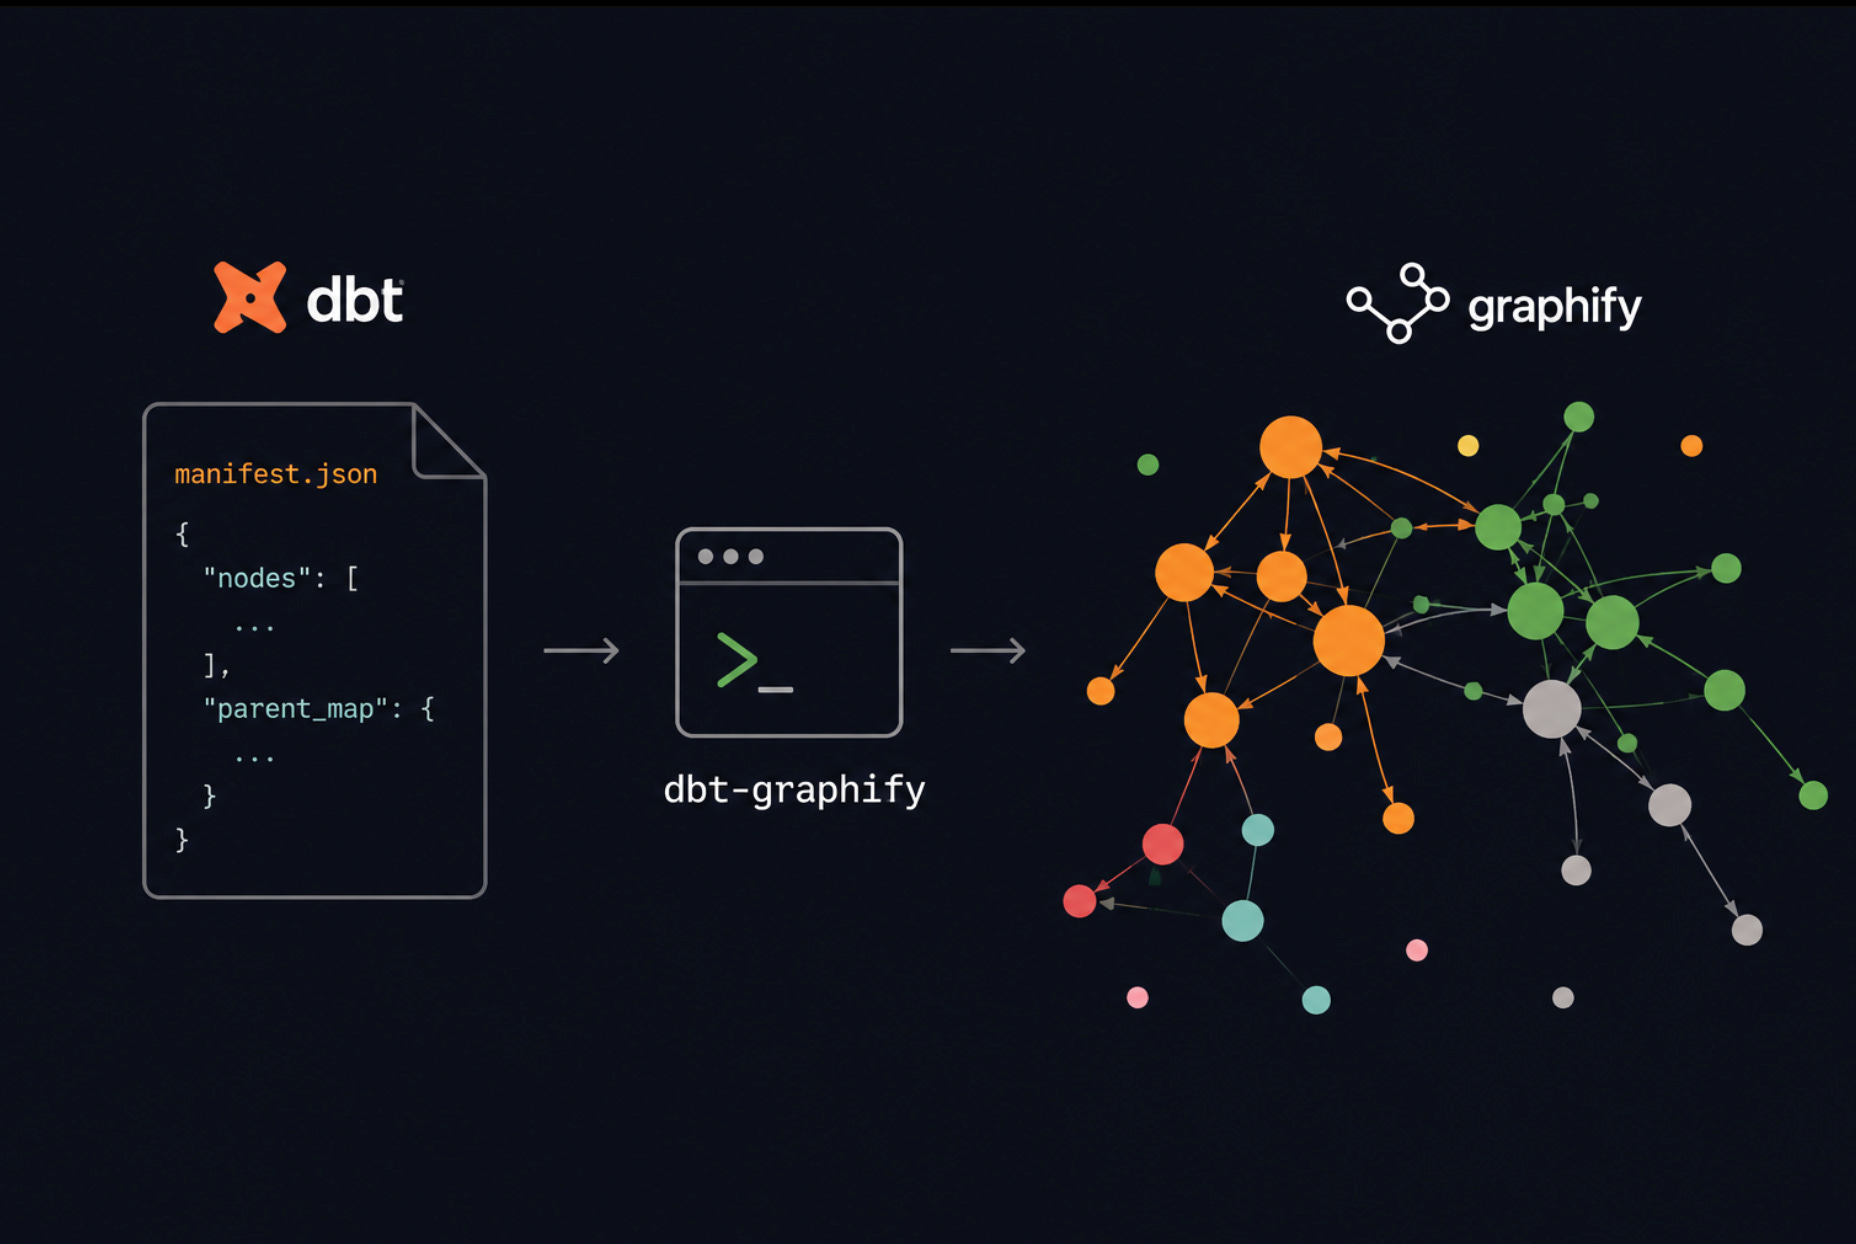
dbt-graphify bridges the two. It reads the manifest and reshapes it into exactly the format graphify expects: flat nodes with materialization type, file location, database, schema, column lists, and full lineage maps — layer semantics included. No database. No embeddings. No cloud account. Drop it into any dbt project, run one command, and graphify queries work the way they should have from the start.
The full AI stack is still the right answer when you need semantic search across business concepts. This is for everything else.
Check the repo: github.com/ponderedw/graphify-dbt
Getting it running
Two tools, one pipeline. dbt-graphify reads the manifest and builds the graph; graphify queries it.
Install both:
# Parse dbt manifests into a knowledge graph
pip install dbt-graphify

# With topology-based community detection (recommended for large projects)
pip install "dbt-graphify[clustering]"

# Query the graph and generate the HTML visualization
pip install graphifyy
Note the package name: it’s graphifyy (double-y) on PyPI, though the CLI command you actually run is graphify. We’d recommend uv tool install graphifyy or pipx install graphifyy over plain pip install — both isolate the package in their own environment, which avoids a ModuleNotFoundError that shows up with plain pip if your shell resolves a different Python than the one graphify was installed into.
pip install graphifyy only gets you the CLI. To make Claude Code (or Codex, Cursor, Gemini CLI, and a dozen others) reach for graphify automatically instead of reading files one at a time, run:
graphify installThis registers graphify as a skill in your AI assistant’s config — it nudges the assistant to run graphify query before it starts grepping through raw source. If you want it enforced rather than just suggested, graphify install --project --strict blocks the assistant’s first raw file read of a session and redirects it to the graph instead, then reverts to a soft nudge for the rest of the session. Platform-specific installs work the same way — graphify install --platform codex, --platform cursor, --platform gemini, and so on.
The [clustering] extra installs networkx and unlocks Louvain community detection — an algorithm that finds tightly-connected subgraphs by looking at the shape of the DAG rather than any labels. On the demo project in the repo, a 45-model educational analytics project, it finds four functional clusters without any configuration: student outcomes and at-risk analytics, activities and resource allocation, scheduling and teaching load, and courses and curriculum — purely from which models share upstream and downstream neighbors. On a real project with hundreds of models it surfaces domain boundaries that aren't explicit anywhere in the project structure. Without it, dbt-graphify falls back to grouping by layer — source, staging, intermediate, mart. Fully queryable either way.
Run dbt-graphify against your manifest:
# Auto-detect manifest.json in standard dbt target/ locations
dbt-graphify

# Explicit path (useful in monorepos)
dbt-graphify path/to/target/manifest.json
This writes everything to graphify-out/: a graph.json in NetworkX node-link format, a lineage.json with full ancestor and descendant maps, a GRAPH_REPORT.md summarizing the architecture, and a graph.html interactive D3 visualization. dbt-graphify does no querying — its only job is producing those files correctly from the manifest.
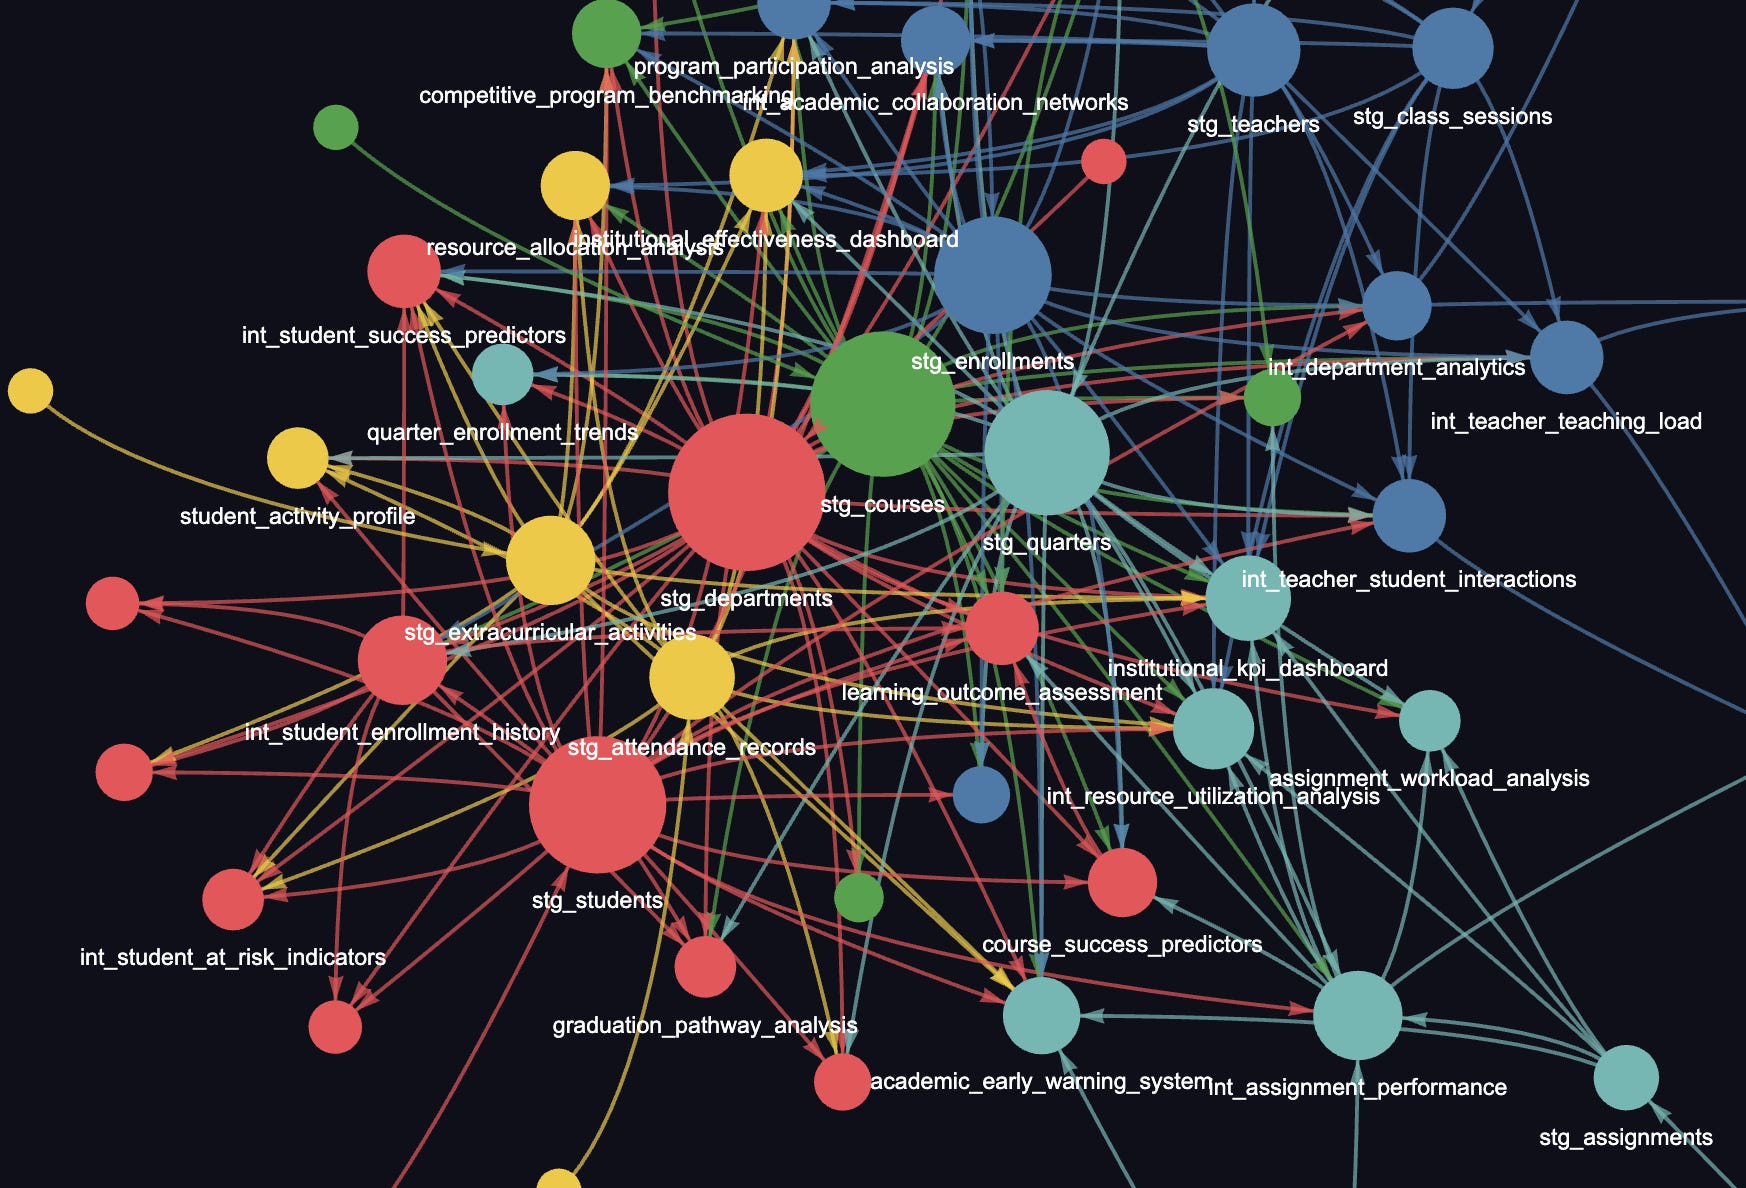
From there, graphify takes over. The repo includes a working demo — clone it, compile the dbt_project/ with dbt compile, run dbt-graphify, and you have a queryable educational analytics graph in under a minute:
graphify query "which models depend on stg_students?"
graphify query "what breaks if I change stg_enrollments?"
graphify path "stg_courses" "course_success_predictors"
graphify explain "int_department_analytics"
All BFS traversal on the local graph.json — no LLM calls, no API key, no network. The answers come from the graph structure dbt-graphify produced from the manifest.
One more thing: CLAUDE.md
Running dbt-graphify also writes a CLAUDE.md at your repo root — or updates its own section in-place if one already exists. The file contains a single instruction block:
## dbt lineage queries

This project has a graphify knowledge graph at graphify-out/graph.json.

Always use graphify commands to answer questions about models,
dependencies, lineage, or blast radius — do not grep SQL files.

    graphify explain "<model>"
    graphify path "<source>" "<target>"
    graphify query "<question>"

To rebuild: dbt-graphify path/to/manifest.json
Claude Code reads CLAUDE.md at session start and treats its contents as standing instructions. With this in place, a new session in the repo doesn’t need a prompt like “use graphify for lineage questions” — it just does. The conversation earlier in this post would have gone straight to graphify explain instead of spending several tool calls figuring out what to reach for.
The write is scoped: if CLAUDE.md already exists and doesn’t contain our block, dbt-graphify leaves it alone. If it does contain a block from a previous run or you manually added the following tags:
<!-- dbt-graphify start -->
   ...
<!-- dbt-graphify end -->
only the manifest path gets updated. Nothing else in the file is touched.
What it’s actually useful for
The most immediate use case is blast-radius analysis. Before changing a staging model, you want to know how many downstream models it feeds and which marts it ultimately lands in. lineage.json has the full ancestor and descendant maps computed via BFS — read it directly in Python or ask graphify:
graphify query "what breaks if I change stg_enrollments?"Traversal: BFS depth=2 | Start: ['stg_enrollments'] | 11 nodes found
NODE stg_enrollments [community=int_department_analytics]
NODE int_department_analytics [community=int_department_analytics]
NODE int_student_enrollment_history [community=stg_departments]
...
EDGE stg_enrollments --> int_department_analytics
EDGE int_department_analytics --> department_overview
EDGE int_student_enrollment_history --> student_academic_summaryOn the demo project that returns the full chain: both intermediate models that read from stg_enrollments, and the three marts that depend on those intermediates. No scanning, no guessing.
The second case is onboarding. A new engineer joins a dbt project with 150 models and no documentation. GRAPH_REPORT.md gives them the full architecture in one file. graphify explain goes further, showing a single node’s full context:
graphify explain "int_department_analytics"Node: int_department_analytics
ID: model.DbtEducationalDataProject.int_department_analytics
Source: models/intermediate/int_department_analytics.sql
Type: concept
Community: stg_enrollments
Degree: 7
Connections (7):
<-- stg_departments [] []
<-- stg_courses [] []
<-- stg_students [] []
<-- stg_enrollments [] []
<-- stg_teachers [] []
--> department_efficiency_report [] []
--> teacher_performance_dashboard [] []The third case is Claude Code integration. Install the graphify skill and lineage questions go through the graph instead of the files:
“What feeds
teacher_performance_dashboard?”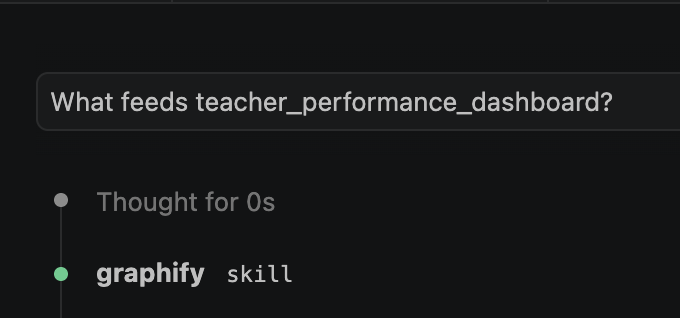
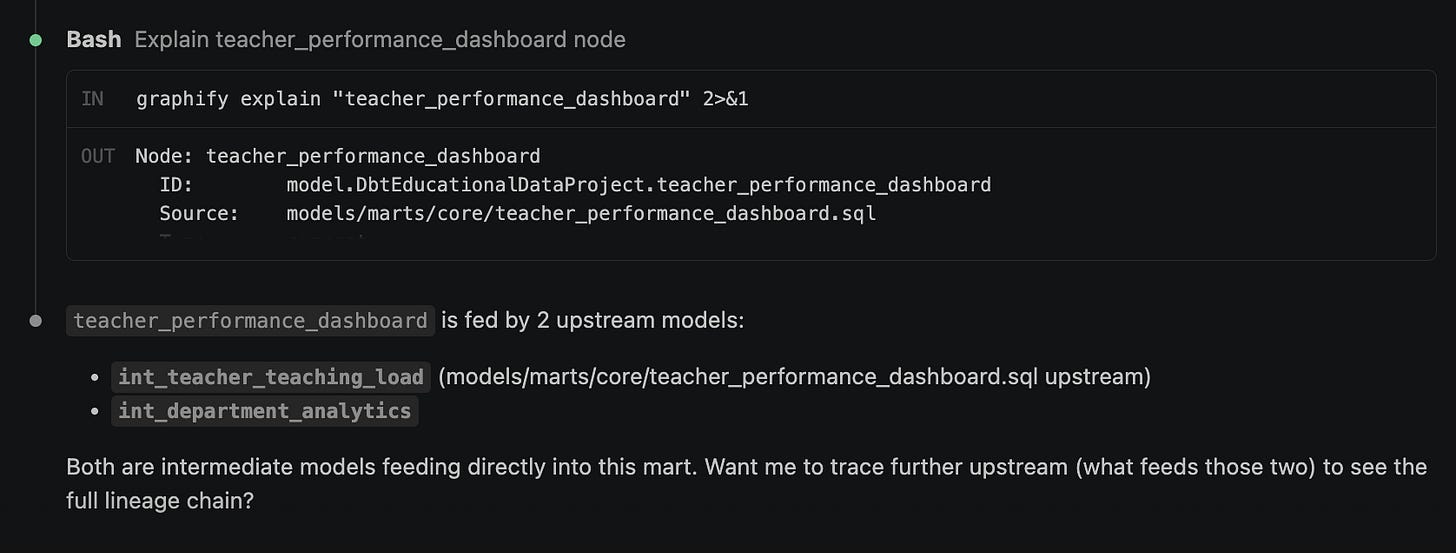
“If I rename a column in
stg_courses, what downstream models break?”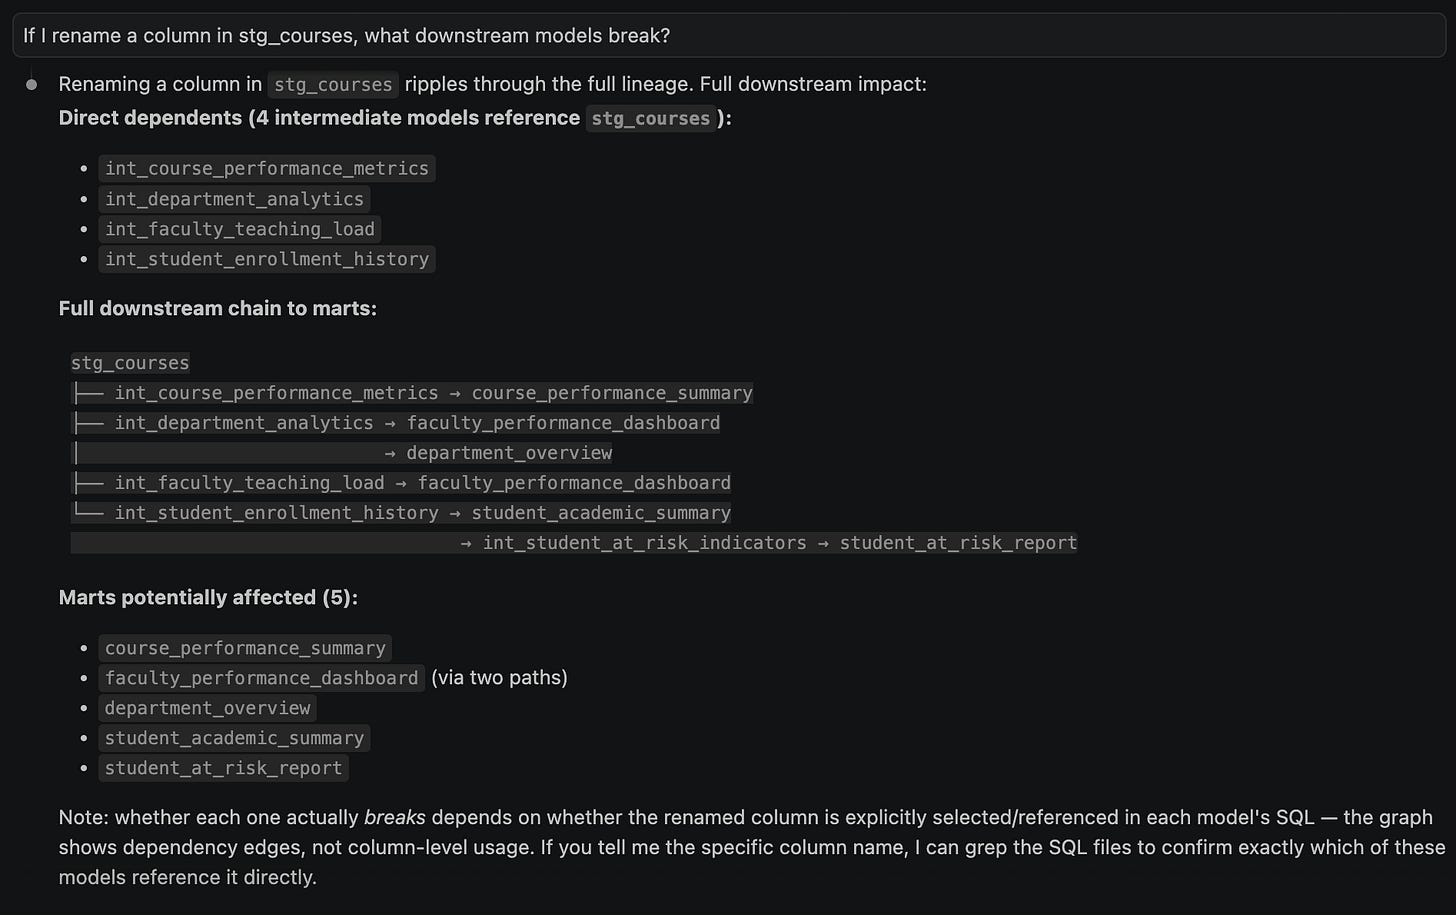
One caveat: column-level lineage isn't in the graph yet — it's on the roadmap. Ask about a model and graphify answers from the graph; ask about a specific column and it still has to fall back to reading the file.
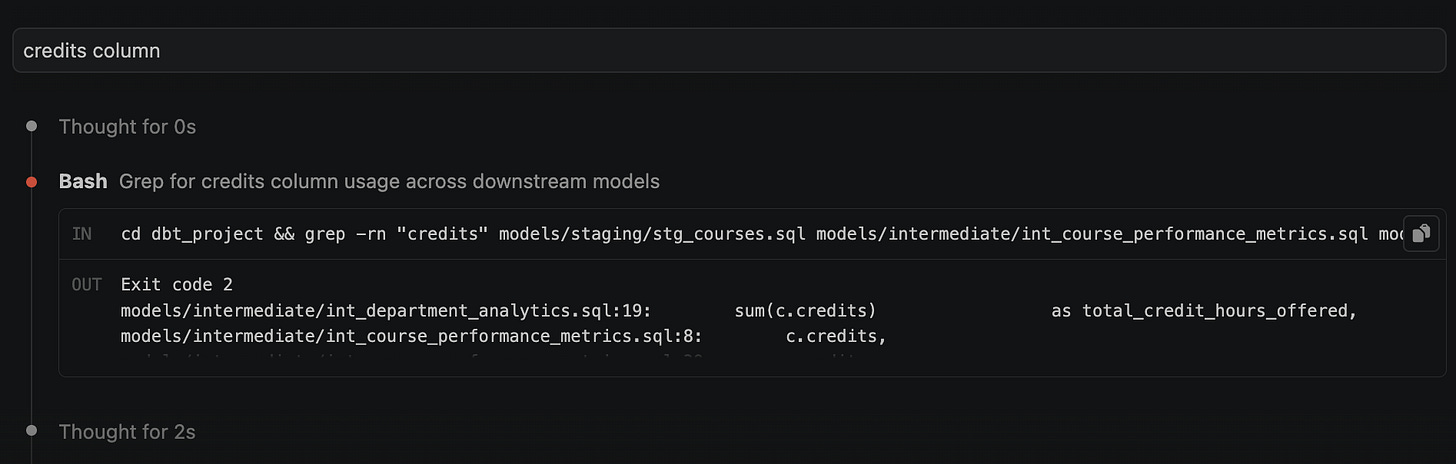
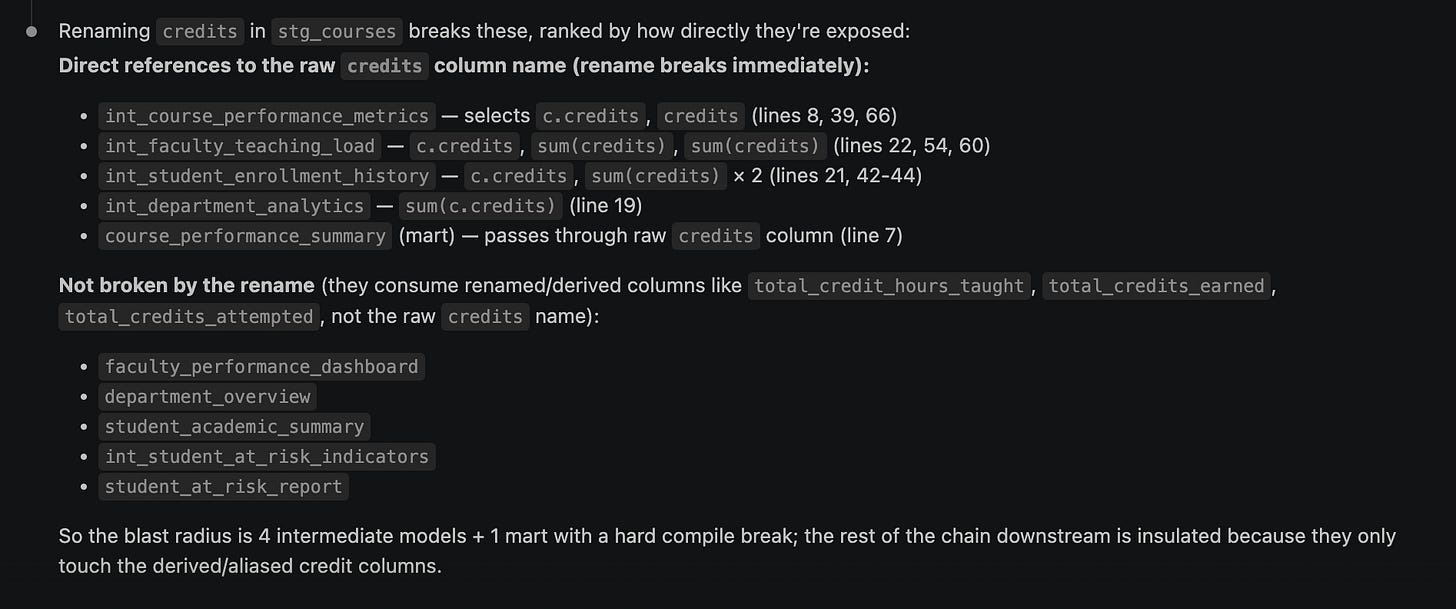
“Which marts depend on
int_department_analytics?”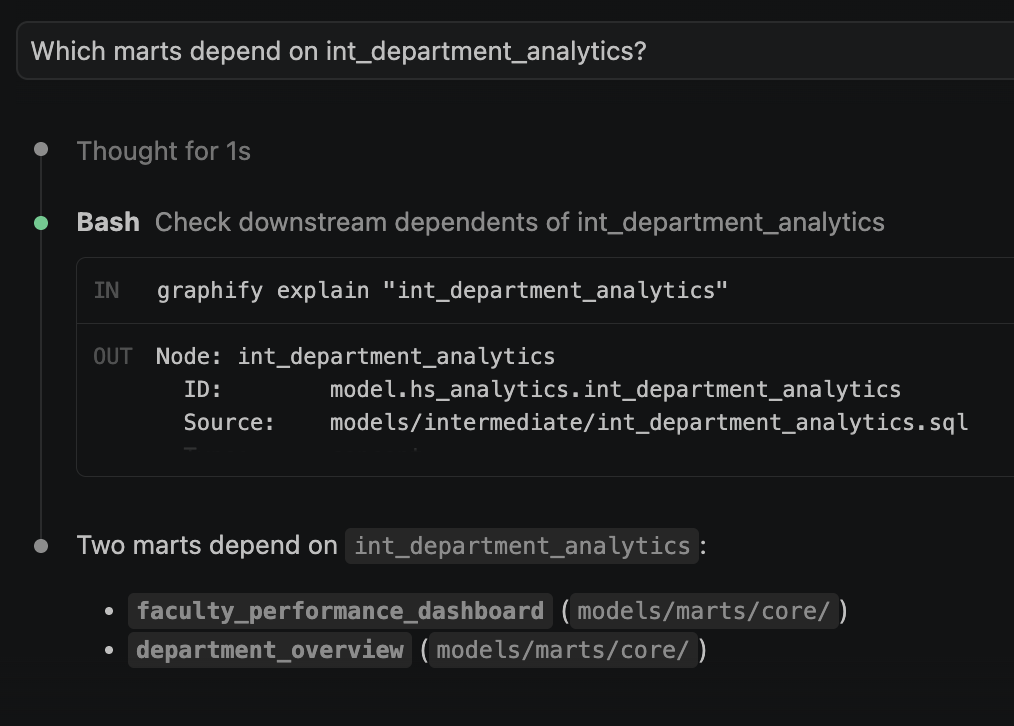
“Trace
stg_attendance_recordsall the way tostudent_retention_analysis.”
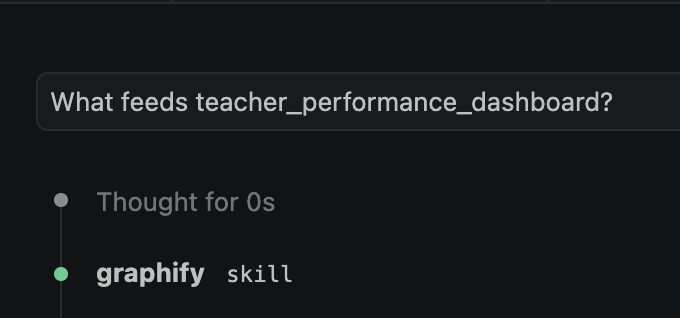
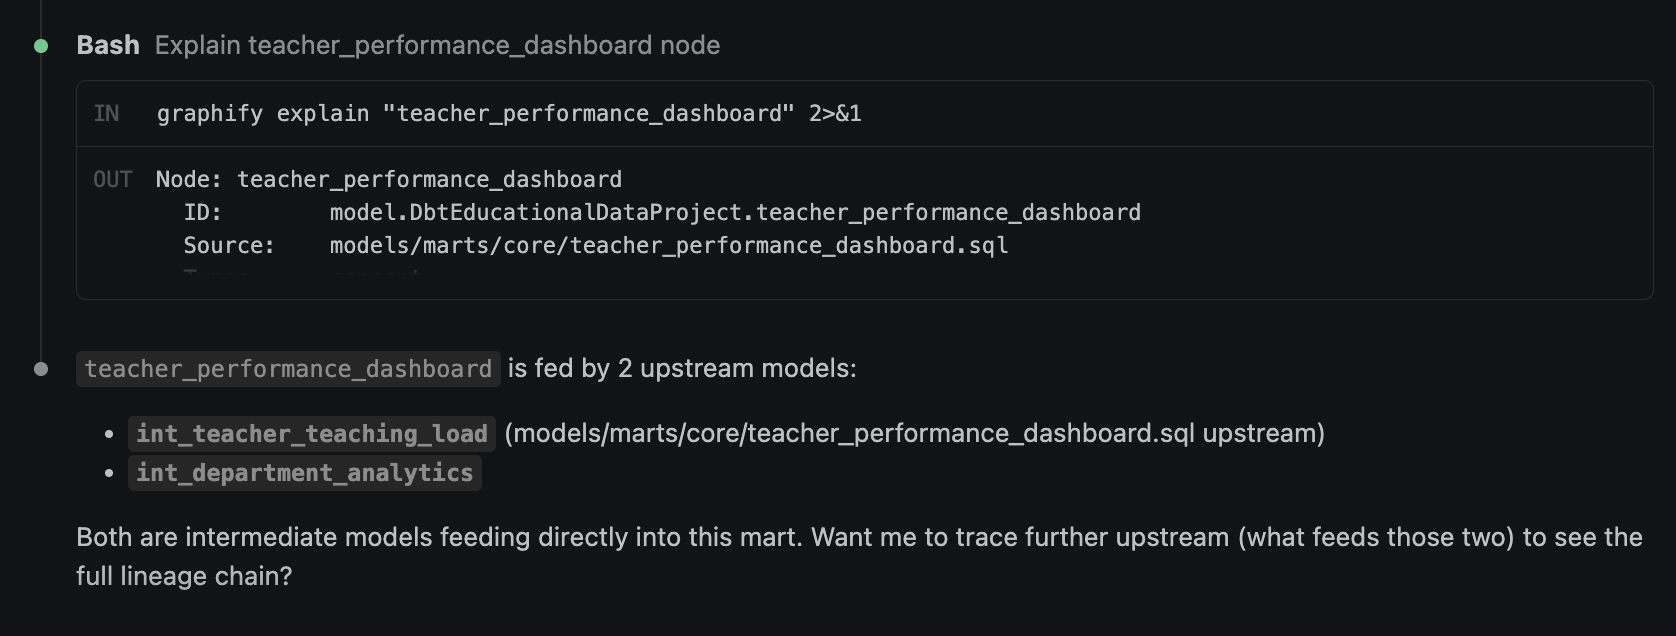
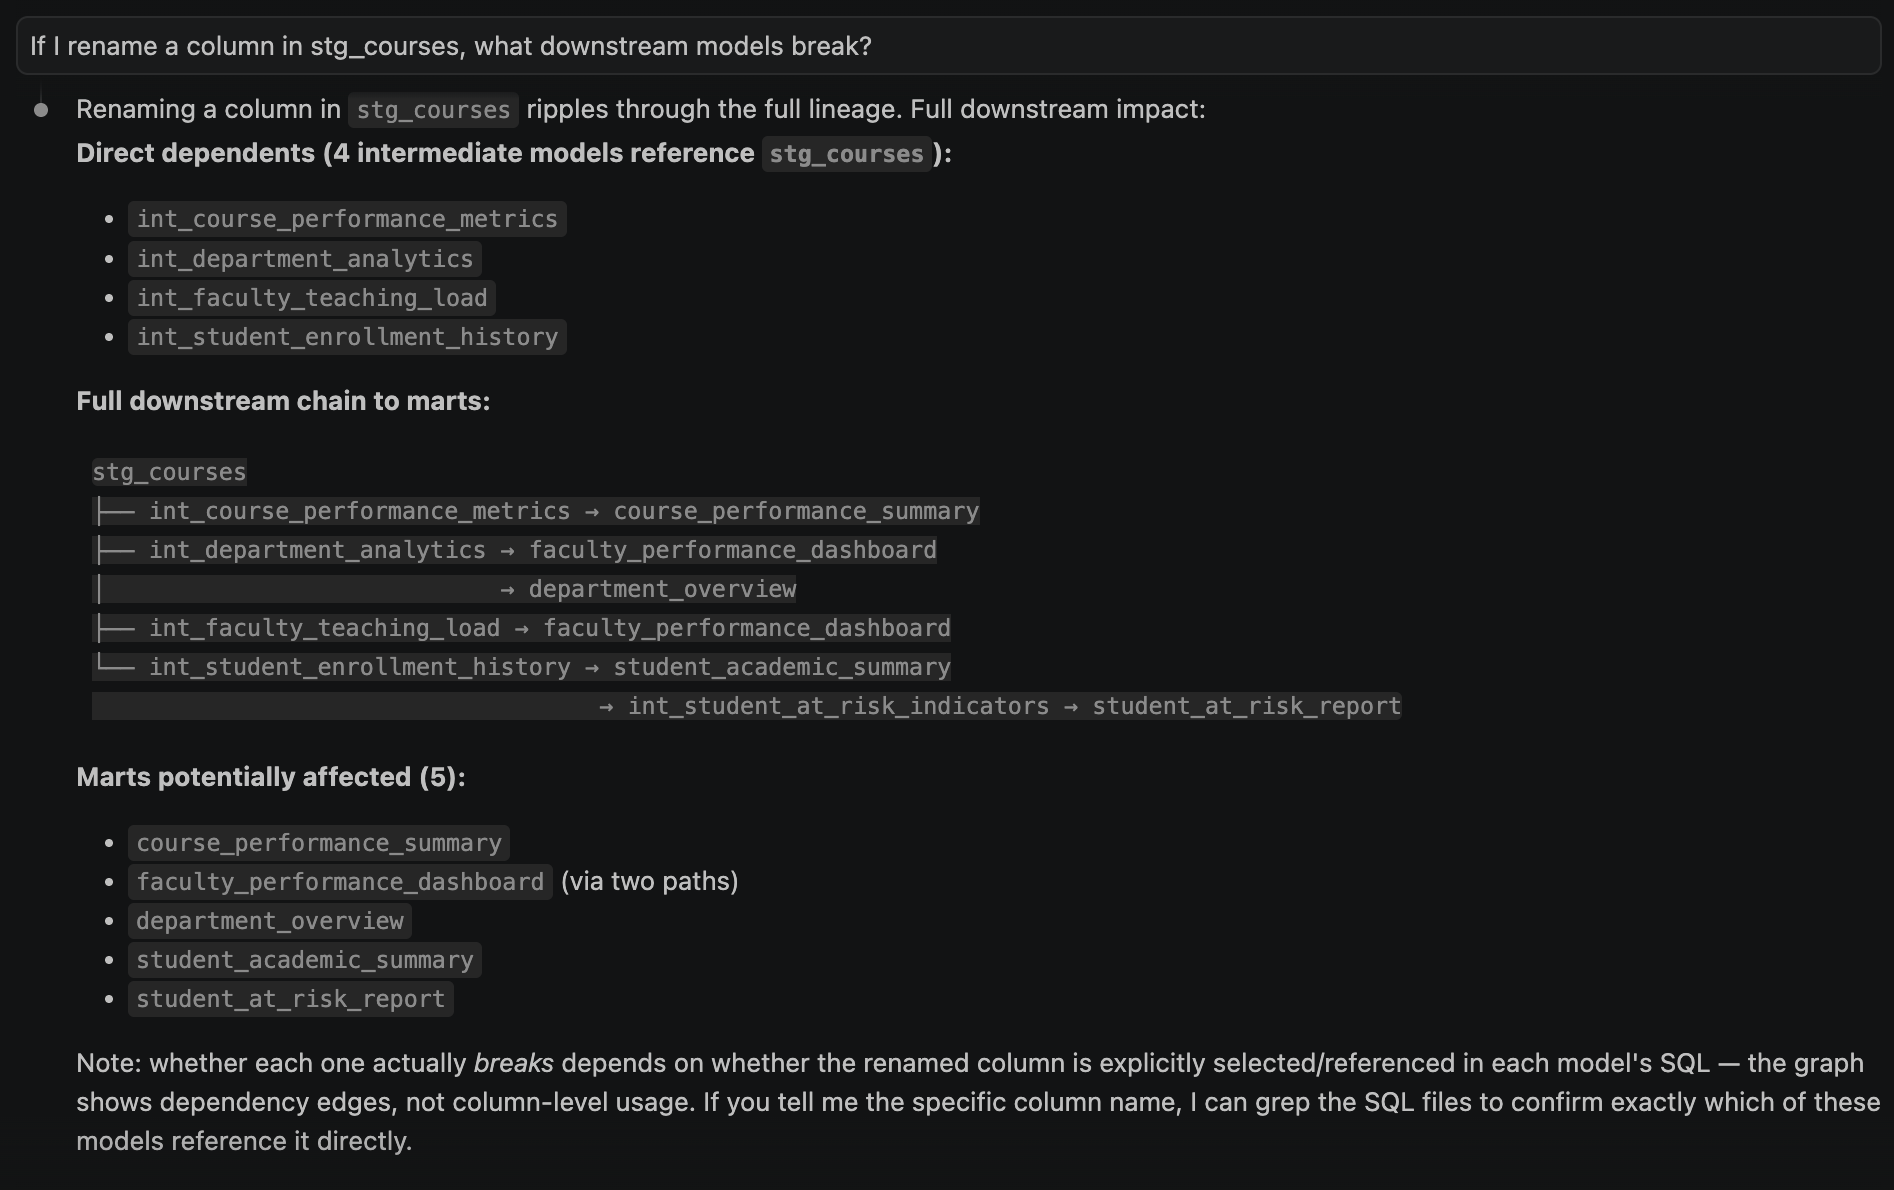
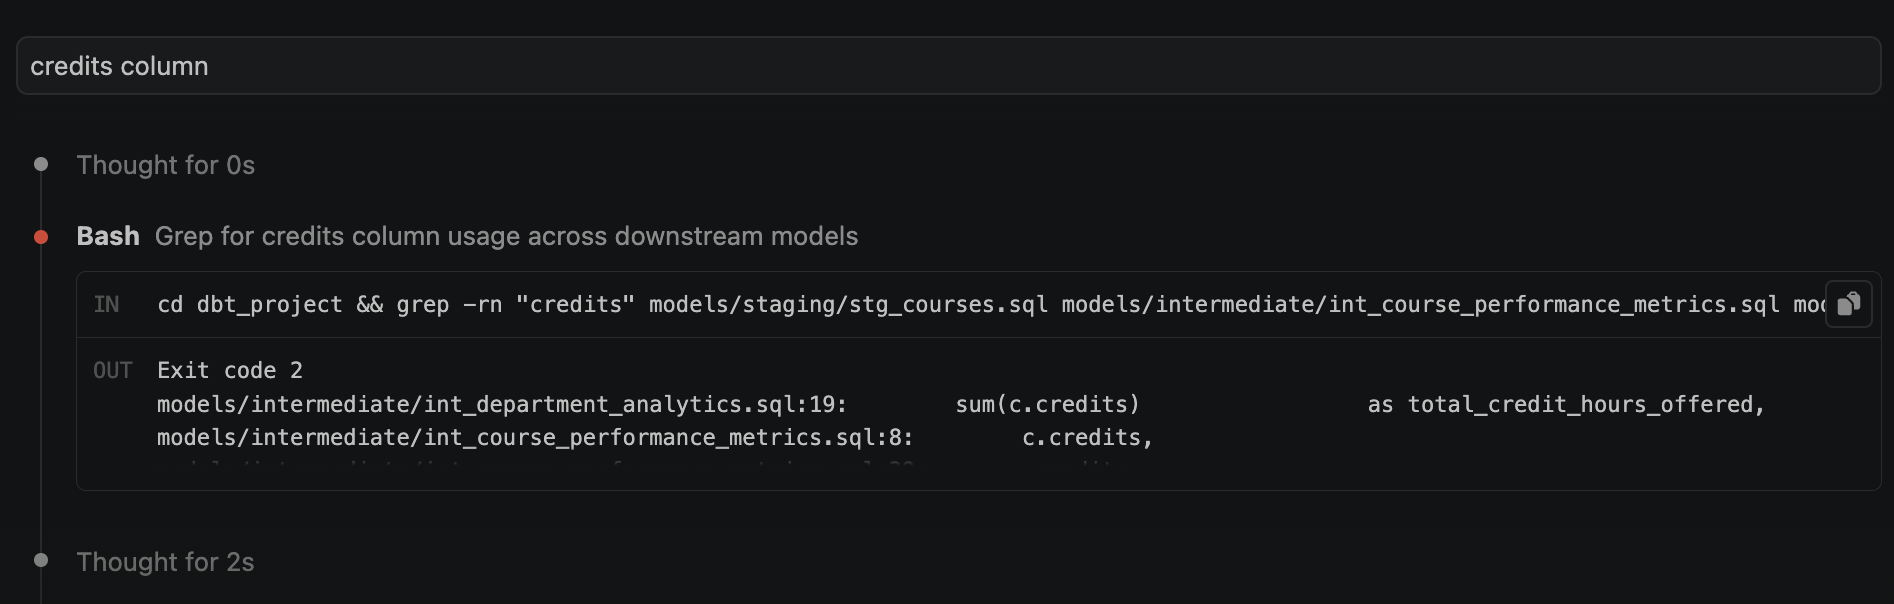
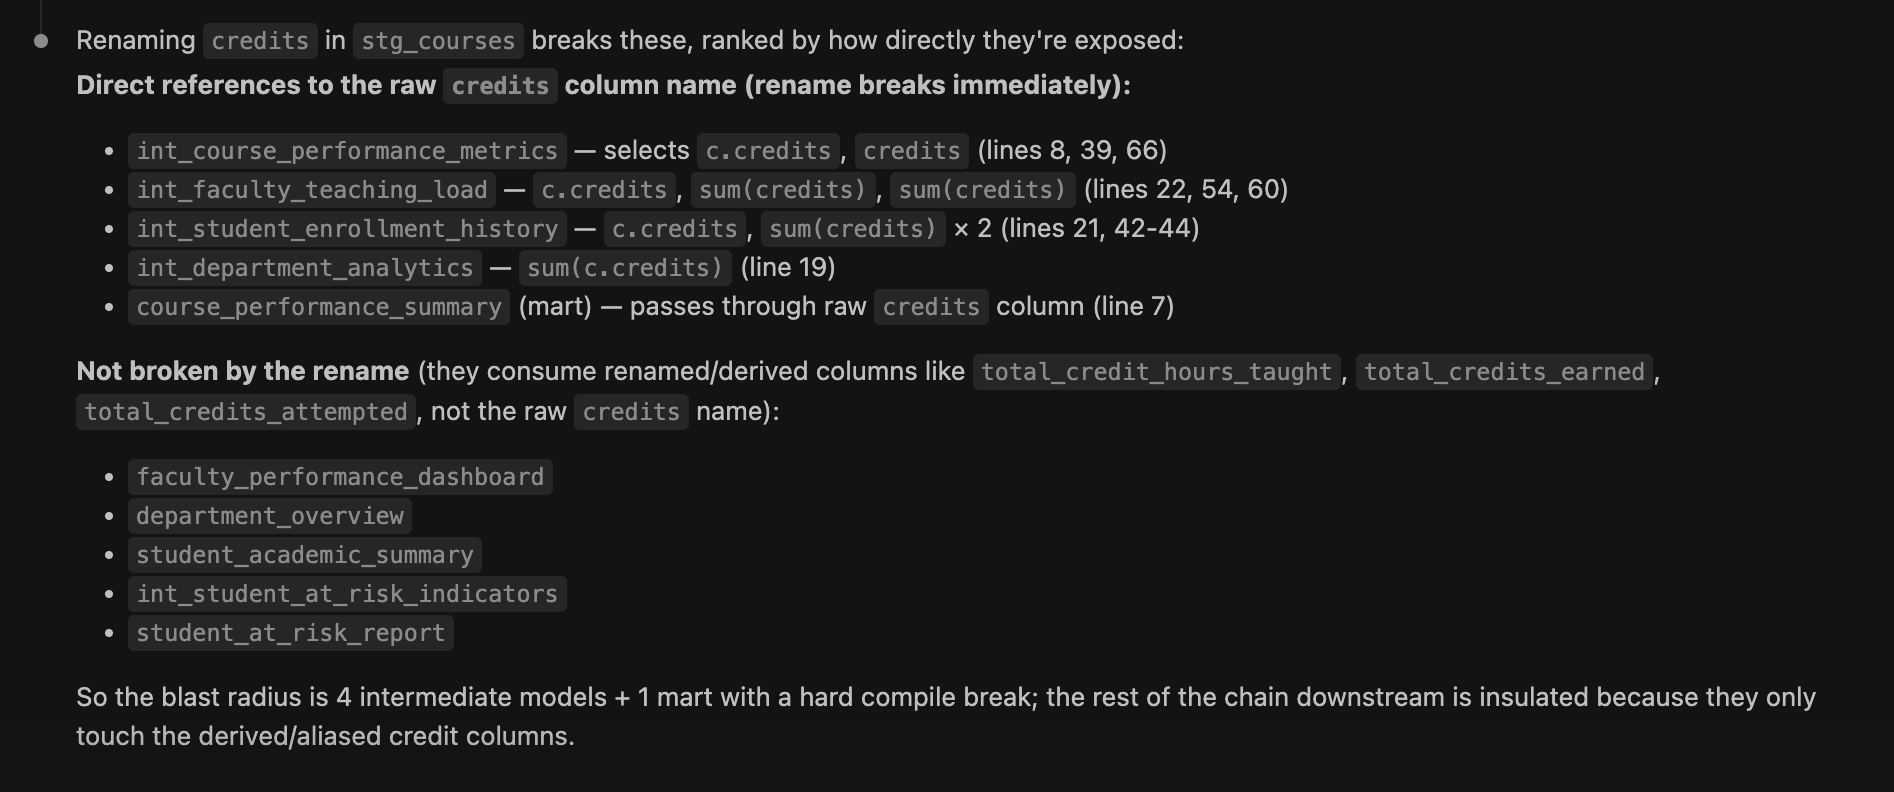
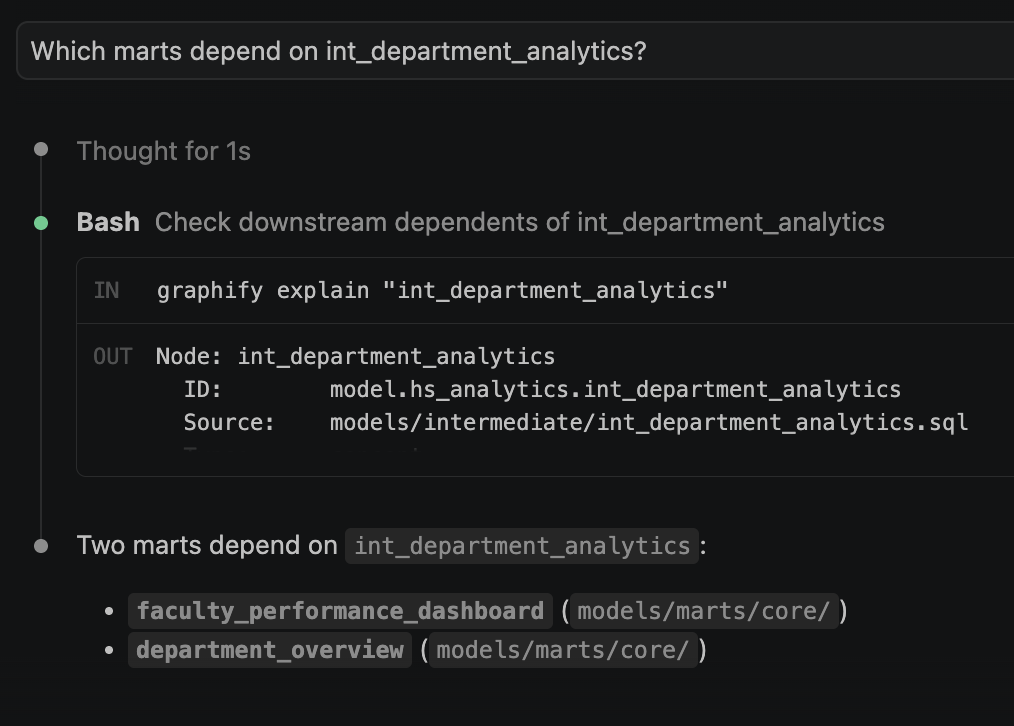
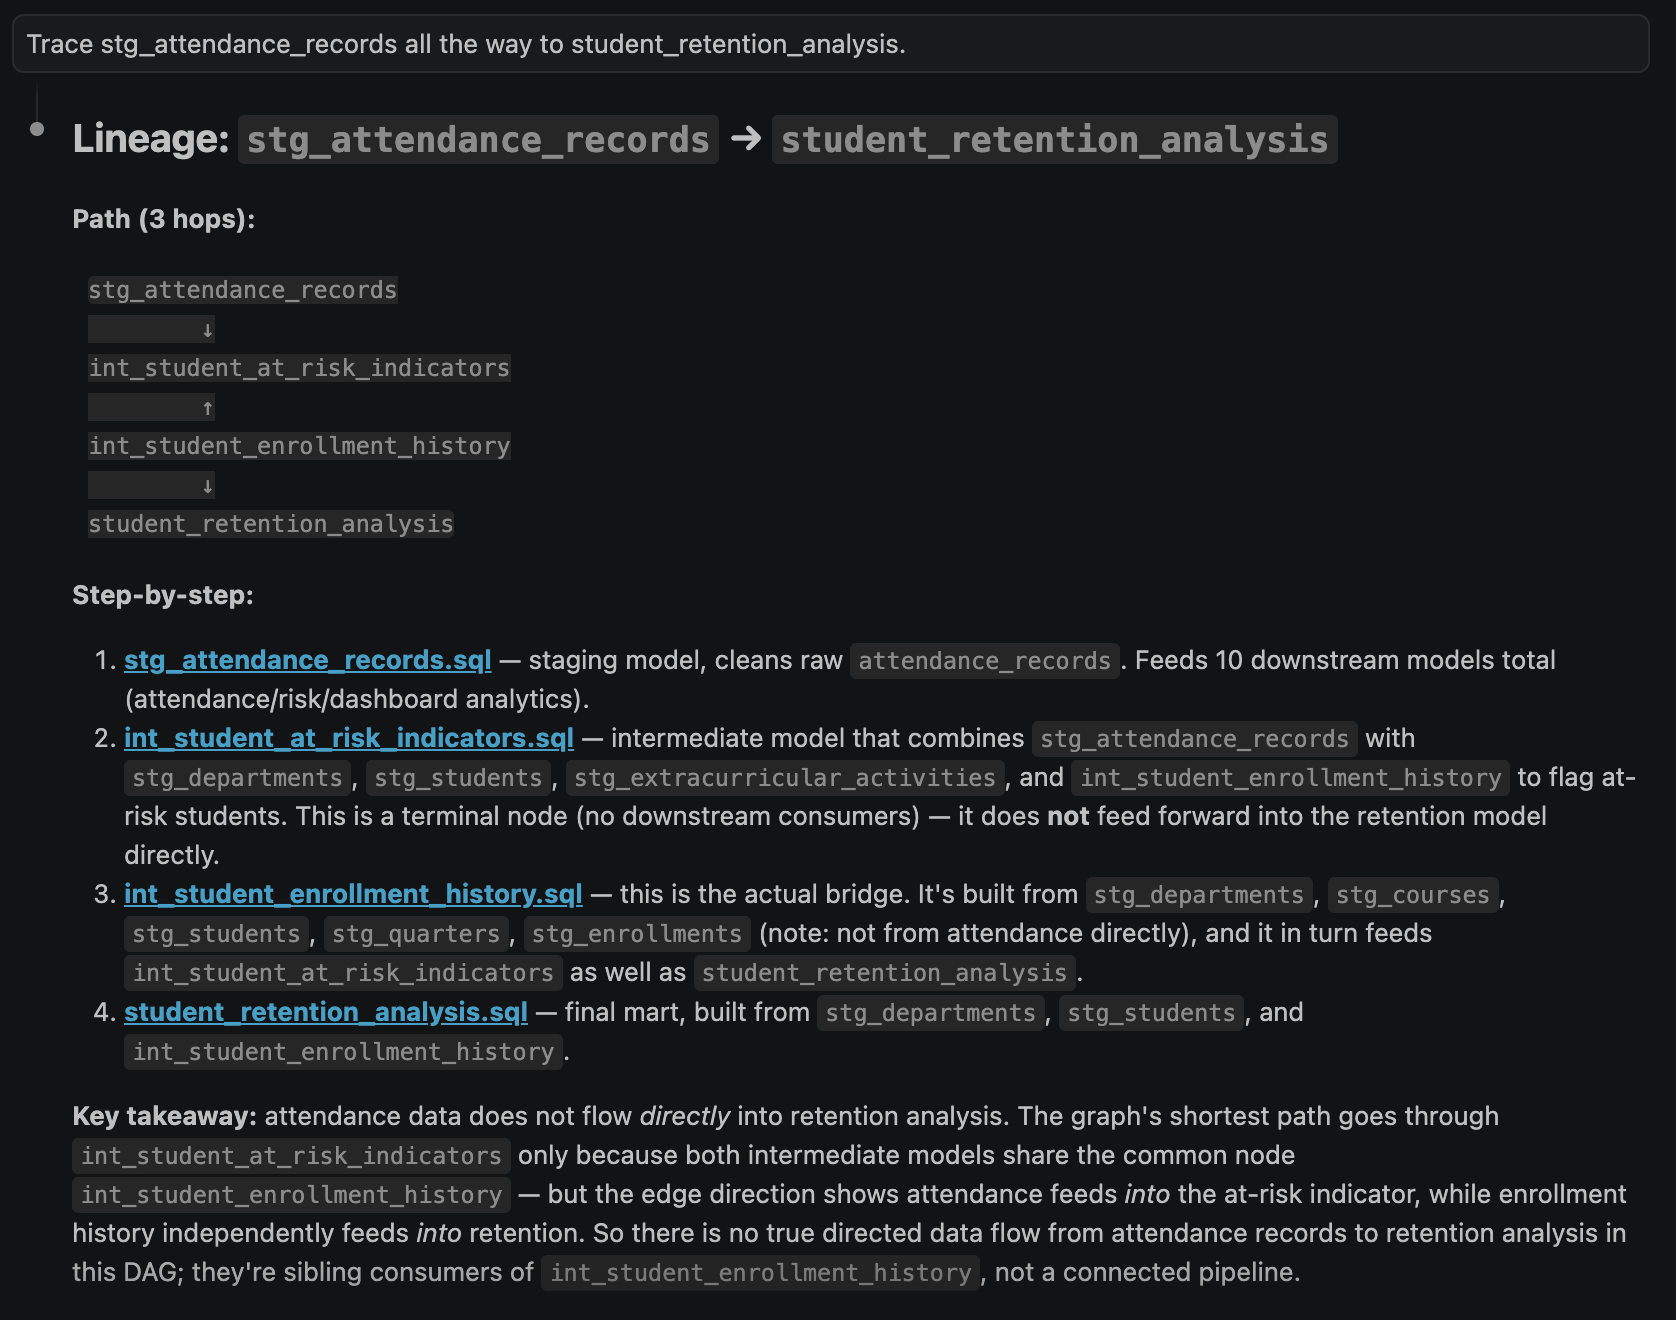
Each becomes one traversal instead of Claude reading every model to find the joins. On a large project this typically cuts 70–90% of the tokens spent on lineage questions.
The fourth is CI. dbt-graphify has no side effects beyond writing graphify-out/, so it slots cleanly into any pipeline: compile the manifest, run dbt-graphify, commit the output. We added exactly this job to our own dbt CI, triggered on every merge to develop.
Under the hood
The package is two modules. parser.py reads the manifest; builder.py turns the parsed data into graphify’s expected format. No LLM calls anywhere — the whole pipeline is deterministic.
The parser’s main job is extracting three things from manifest.json: the node list (models, sources, macros), the edge list (parent_map and child_map, which dbt pre-computes during compilation), and per-node metadata — materialization from config.materialized, file path from original_file_path, columns from the columns dict, database and schema, and raw SQL from raw_code. Layer classification is a small inference function: stg_ prefix → staging, int_ prefix → intermediate, then fqn path segments as a tiebreaker, then mart as the default. If manifest.json is empty — dbt wasn’t compiled, just parsed — the tool falls back to graph_summary.json and reads the raw .sql files directly, using regex to extract {{ ref() }} and {{ source() }} calls and a best-effort SELECT-clause parser to recover column names.
The builder produces four outputs. graph.json is NetworkX node-link format — the exact structure nx.node_link_graph() expects, with all node attributes flat at the top level (graphify reads them via G.nodes[id].get("attr"), so anything nested inside a properties key is invisible to it). lineage.json holds two BFS maps, ancestors and descendants, computed from the adjacency lists the parser built. GRAPH_REPORT.md is a plain-text architecture summary with a per-layer node inventory and a blast-radius table sorted by downstream count. HTML generation is delegated entirely to graphify cluster-only via subprocess — no D3 code lives in this package.
Every node carries two different grouping properties that are easy to conflate. Layer is its position in the transformation pipeline — source, staging, intermediate, mart — always derived from the node’s name and fqn. It answers “where in the pipeline does this model sit?” Community is which functional domain the node belongs to, and it’s what the visualization colors by. A staging model and a mart can share the same community color if they serve the same business domain, even though they sit at opposite ends of the pipeline.
Community detection runs a priority chain: dbt groups first, then tags, then — if [clustering] is installed — Louvain modularity on the undirected projection of the DAG. Direction is dropped because Louvain works on undirected graphs, and structural proximity matters more than flow direction for grouping. Each community is named after its highest-degree node; if Louvain isn’t available in the installed networkx version, it falls back to greedy_modularity_communities. Without [clustering] at all, community falls back to layer — the two properties collapse to the same value, and the visualization colors by pipeline stage instead of domain.
The only required dependency is the Python standard library. PyYAML is optional, networkx is optional. The package has no opinion about which dbt adapter you use.
Wrapping up
dbt-graphify is a small, deterministic bridge: it takes the DAG dbt already computed and reshapes it into something graphify — and by extension, Claude Code — can query directly. No graph database, no embeddings, no cloud account, just a manifest and one CLI command. For blast-radius checks, onboarding, and day-to-day lineage questions in an agent session, that’s enough.
It’s not a replacement for the full AI stack — column-level lineage isn’t there yet, and semantic search across business concepts still needs embeddings and a real graph database. But most lineage questions aren’t semantic, they’re structural, and dbt already has the answer sitting in target/manifest.json. This just stops throwing that away.
Try it on your own project, or start with the demo in the repo: github.com/ponderedw/graphify-dbt. Issues and PRs welcome.