
From AI Conversations to BI Charts
Visualizing semantic-layer analytics with Cube and AI


Introduction
In our previous post, we explored how to bridge the gap between complex data structures and end-users by grounding natural-language queries in a Cube-governed semantic layer. By using RAG, we enabled anyone—from teachers to board members—to query data without needing to touch SQL, GraphQL, or REST APIs.
But while answering a question with text is a great start, data is often best understood visually. Even for those who can write code, the goal is often the same: getting to the insight as quickly as possible. We asked ourselves: Can we move beyond simple text responses and visualize this data directly within the chat interface?
The answer is a resounding yes.
In this post, we’re introducing a new capability that turns conversational insights into immediate, actionable BI charts. We’ve implemented this by leveraging Streamlit’s native charting capabilities combined with custom logic for parsing the AI’s response.
Of course, we aren’t alone in this pursuit—the entire industry is racing toward “conversational BI.” This is simply our take on the problem. Our hope is that this specific implementation provides a blueprint or some inspiration for bringing similar capabilities to your own organization. If you have a different approach or wider experience in this space, we’d love for you to share your thoughts in the comments.
You can find the updated code in the same repository here:
👉 GitHub: https://github.com/ponderedw/dbt-to-cube
Let’s dive into how we move from a simple chat response to a fully rendered chart.
One quick note before we dive in: all of the examples and visualizations in this post use synthetic sample data generated as part of the demo environment.
Quickstart
Ready to see it in action? You can get the entire environment running in just a few steps.
Clone the repository: git clone https://github.com/ponderedw/dbt-to-cube
Configure your environment: Create your .private.env file from the .private.env.template as explained here. This ensures your LLM provider and credentials are ready to go.
Launch the stack: Simply run just all. This automated workflow handles the heavy lifting: spinning up the database, generating mock data, running dbt models, and ingesting metrics into both Cube and Superset. (You can read more about the underlying architecture here).
Access the UI: Head over to http://localhost:8501/, enter your STREAMLIT_PASSWORD, and you’re ready to chat with your data.
From Questions to Visuals
Start by getting familiar with the metadata the RAG layer has indexed:
“Hey. What measures and dimensions do we have?”
Once the AI confirms the available metrics, it’s time to move beyond text. Let’s ask for a specific visualization:
“Can you visualize the total number of course enrollments by difficulty level using a pie chart?”
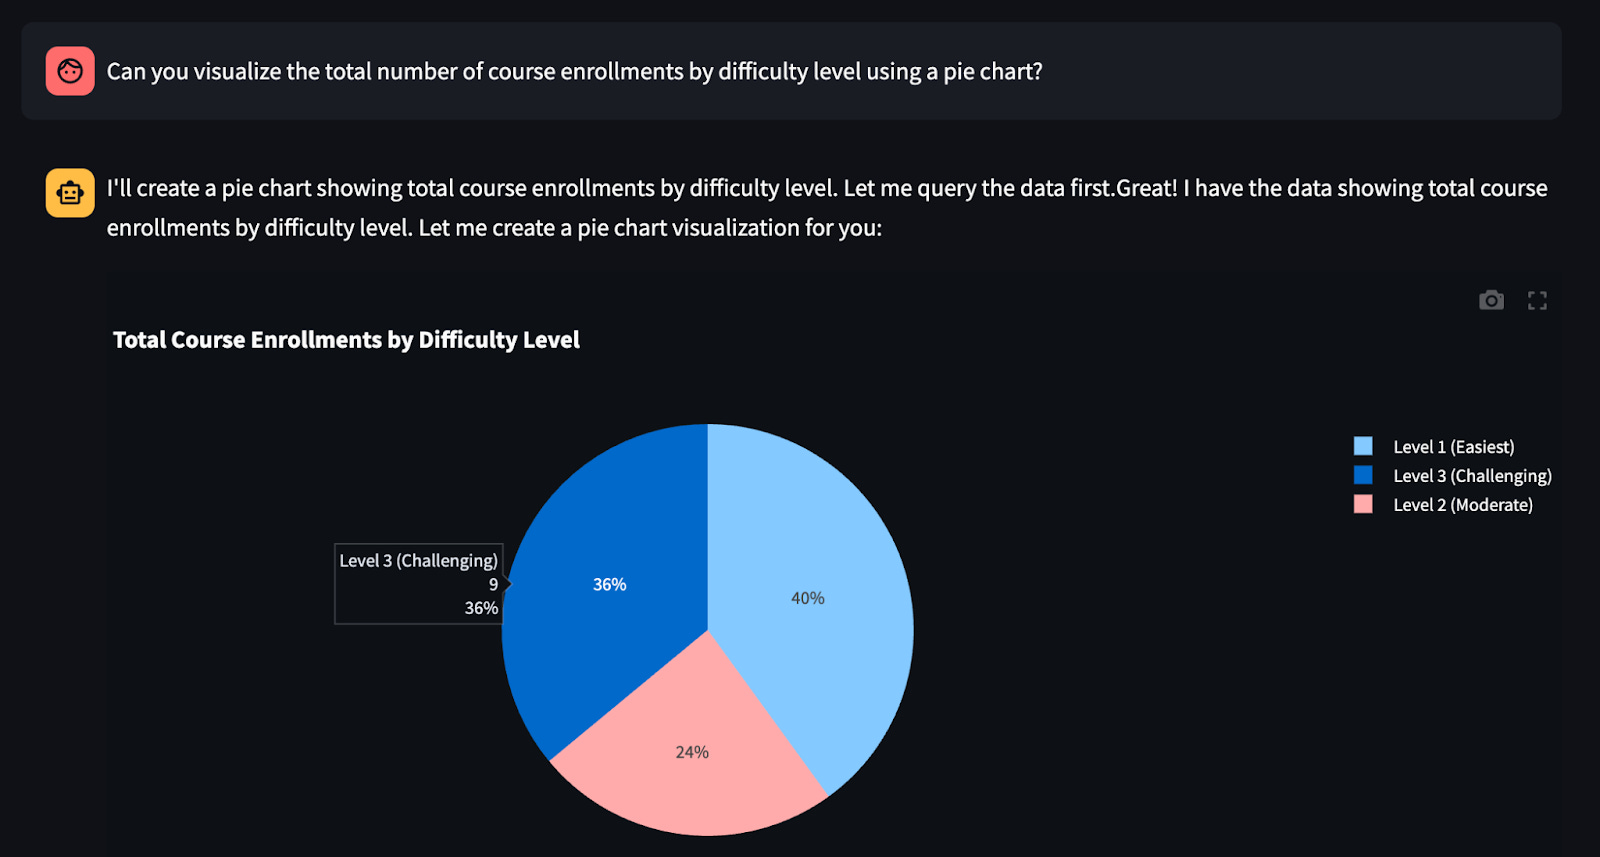
The result? A fully rendered BI graph in just 11 seconds.
Let’s try a different metric and a more dynamic chart type:
“Return the number of students with excellent performance across academic years and visualize it using a line chart.”
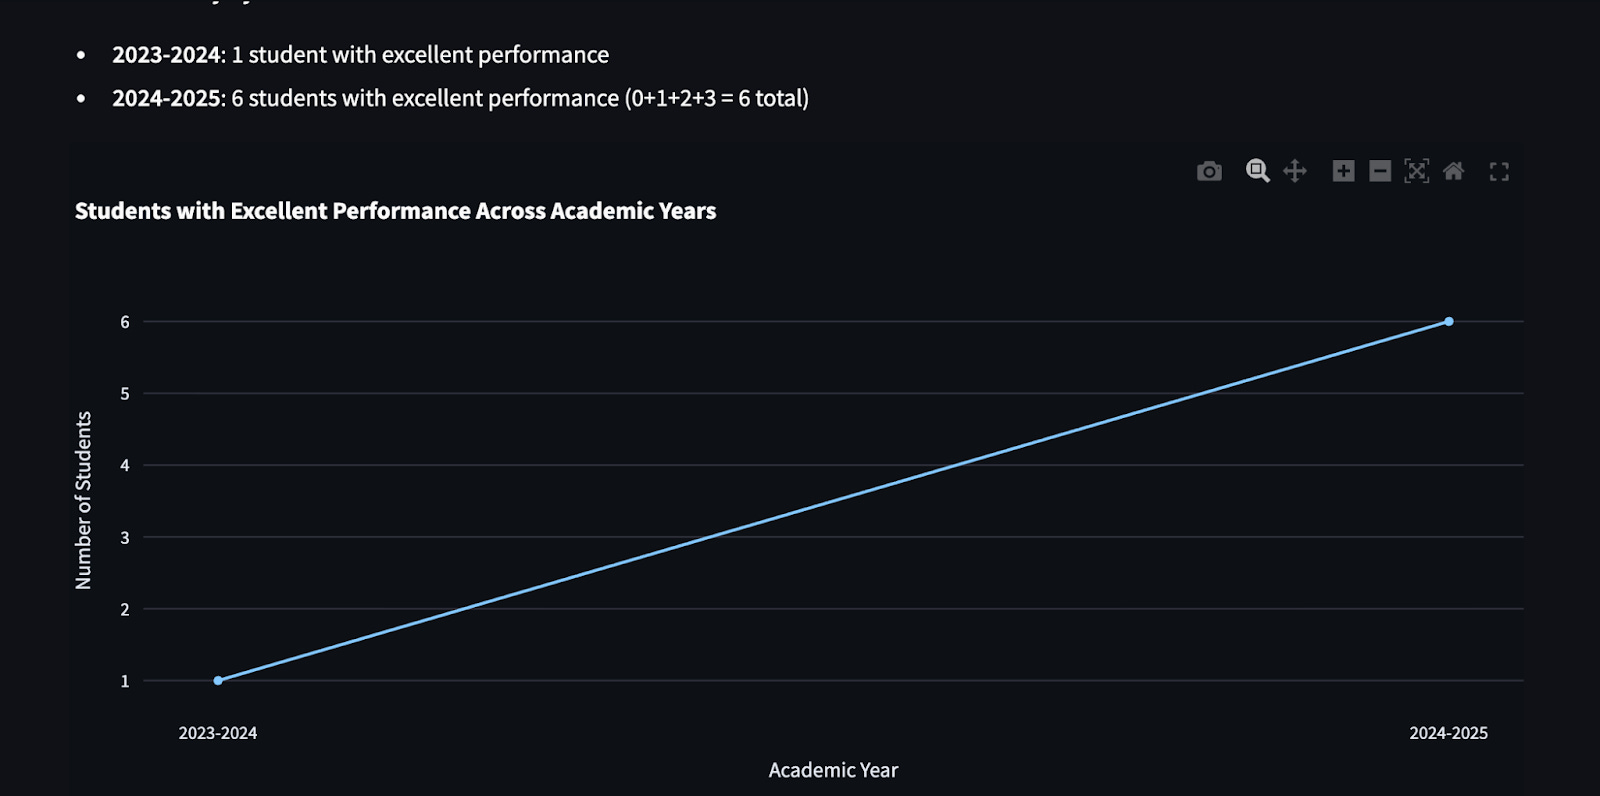
In seconds, you receive an amazing, interactive line chart—mapping complex trends without you ever touching a visualization library.
More to Explore
The system is flexible enough to handle various chart types and comparison logic:
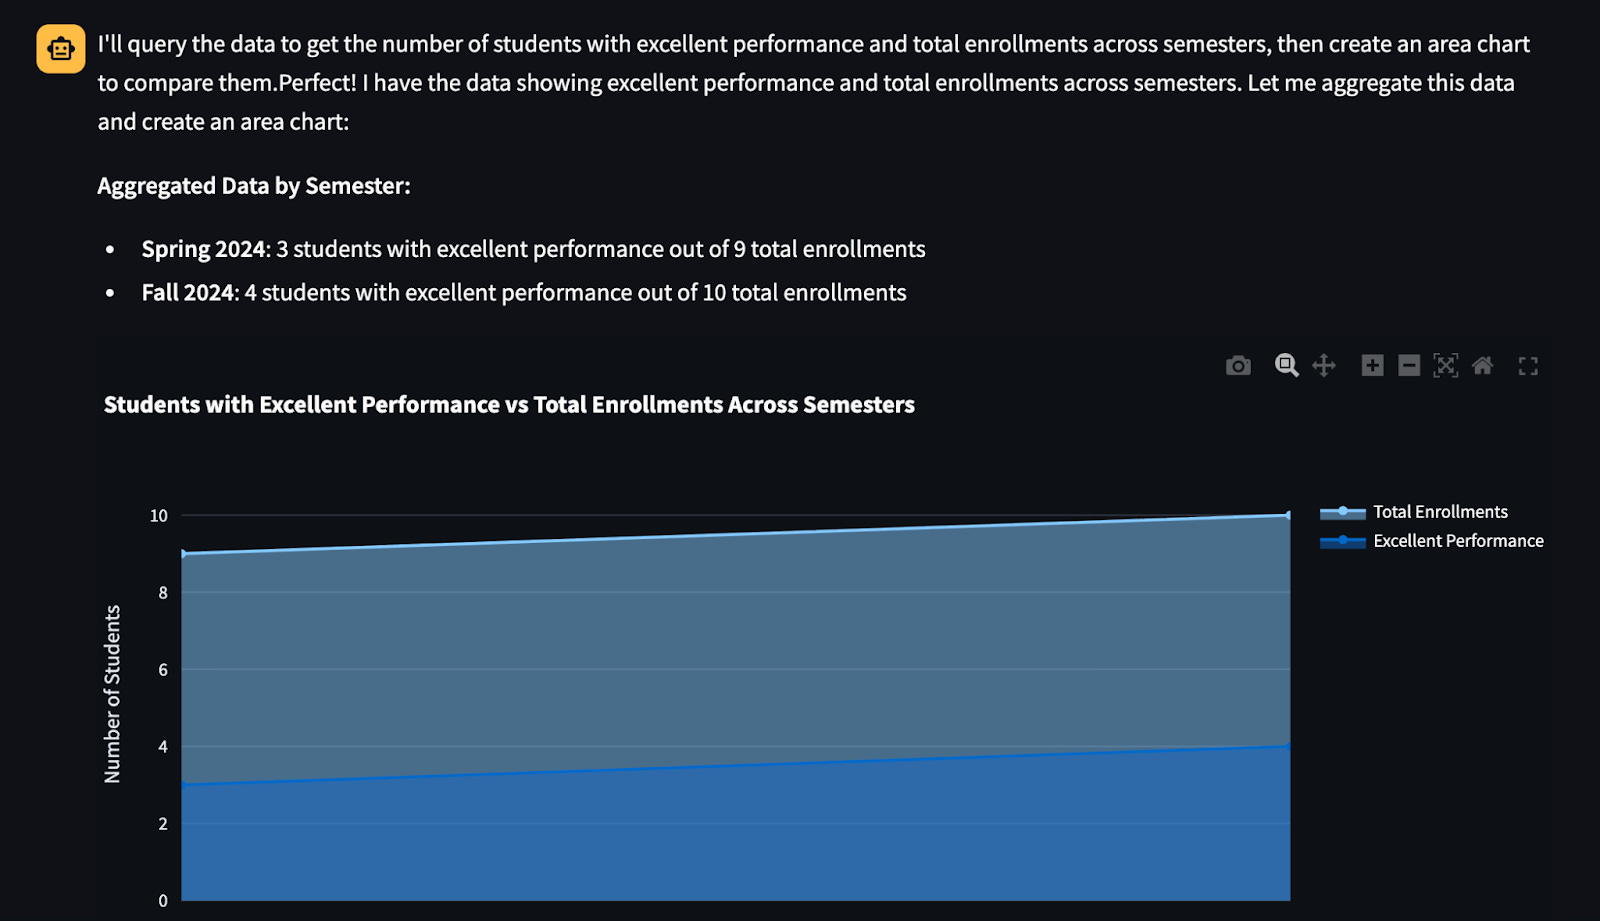
Area Charts: “Can you create an area chart showing the number of students with excellent performance compared to the total number of enrolled students across semesters?”
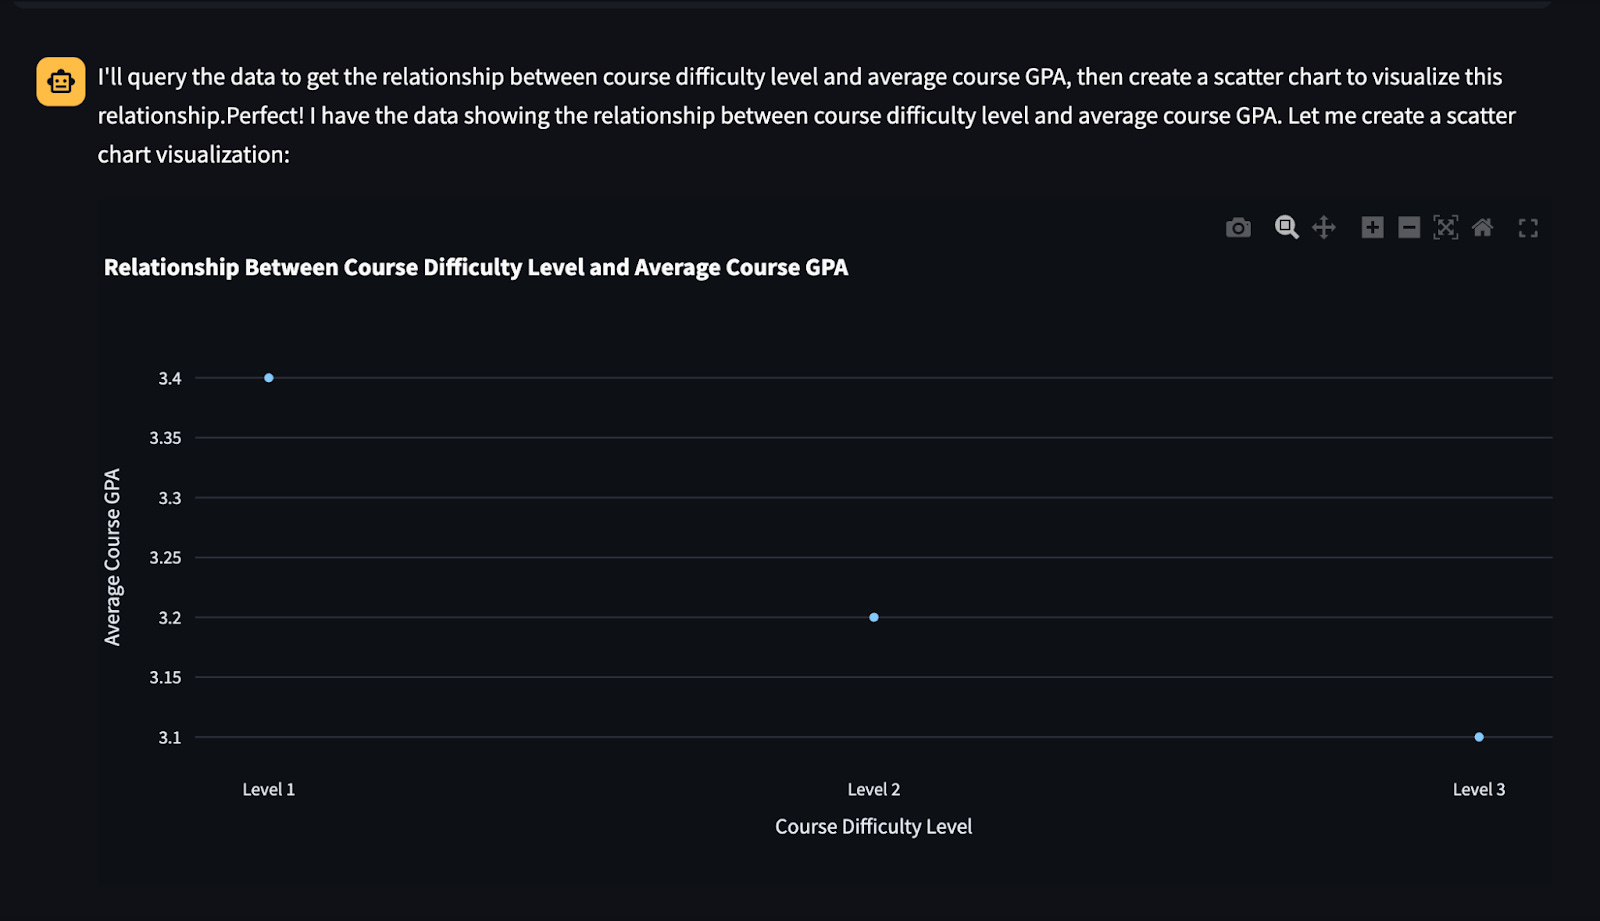
Scatter Charts: “Can you visualize the relationship between course difficulty level and average course GPA using a scatter chart?”
How does it work?
To enable these visualizations, we didn’t need to reinvent the wheel. We kept the same agent-based architecture and Streamlit frontend but introduced two key modifications to the workflow:
1. Enhancing the Prompt (The “Brain”)
We updated our LangChain prompt to give the agent “visual awareness.” It now understands how to structure its output so the frontend knows when a chart is requested.
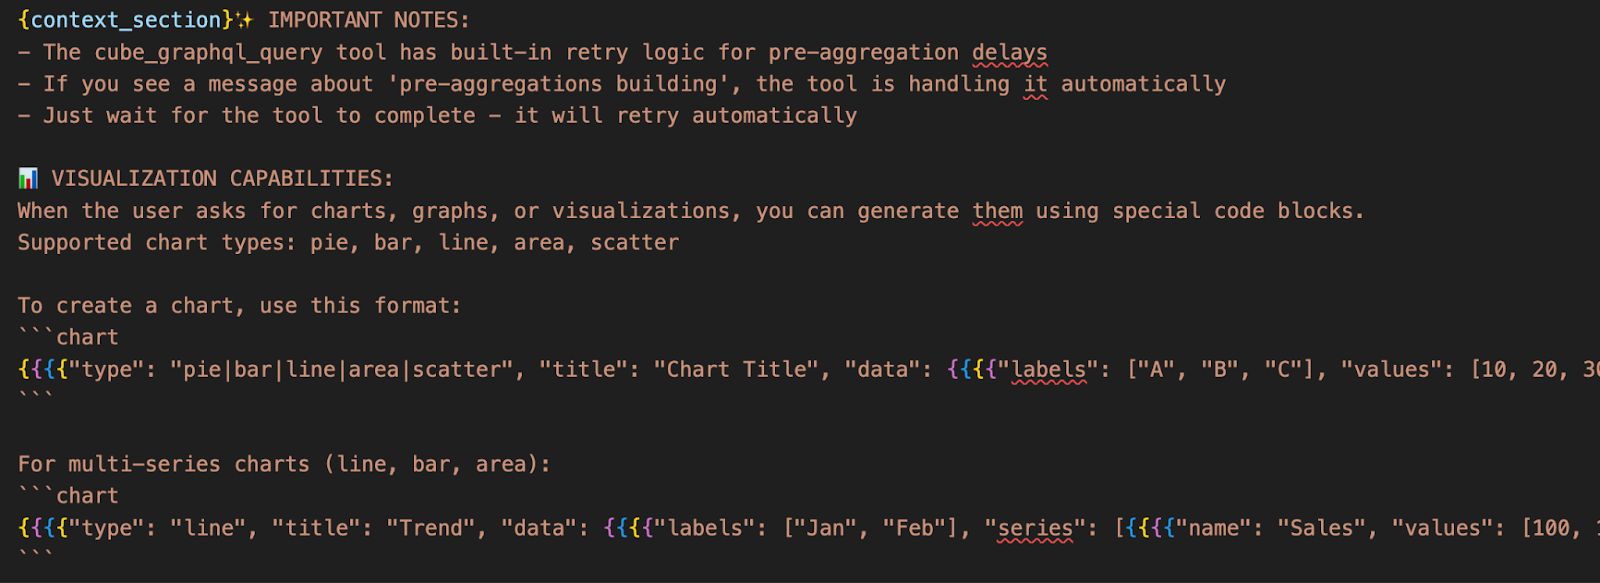
Where to look: You can find the specific instructions we added in cube-to-rag/app/server/chat.py.
2. Intelligent Response Parsing (The “Bridge”)
Once the AI generates a response, the Streamlit application needs to know whether to display a paragraph of text or render a dynamic chart. We updated the handling logic to parse the AI’s response and trigger the appropriate Streamlit chart component.
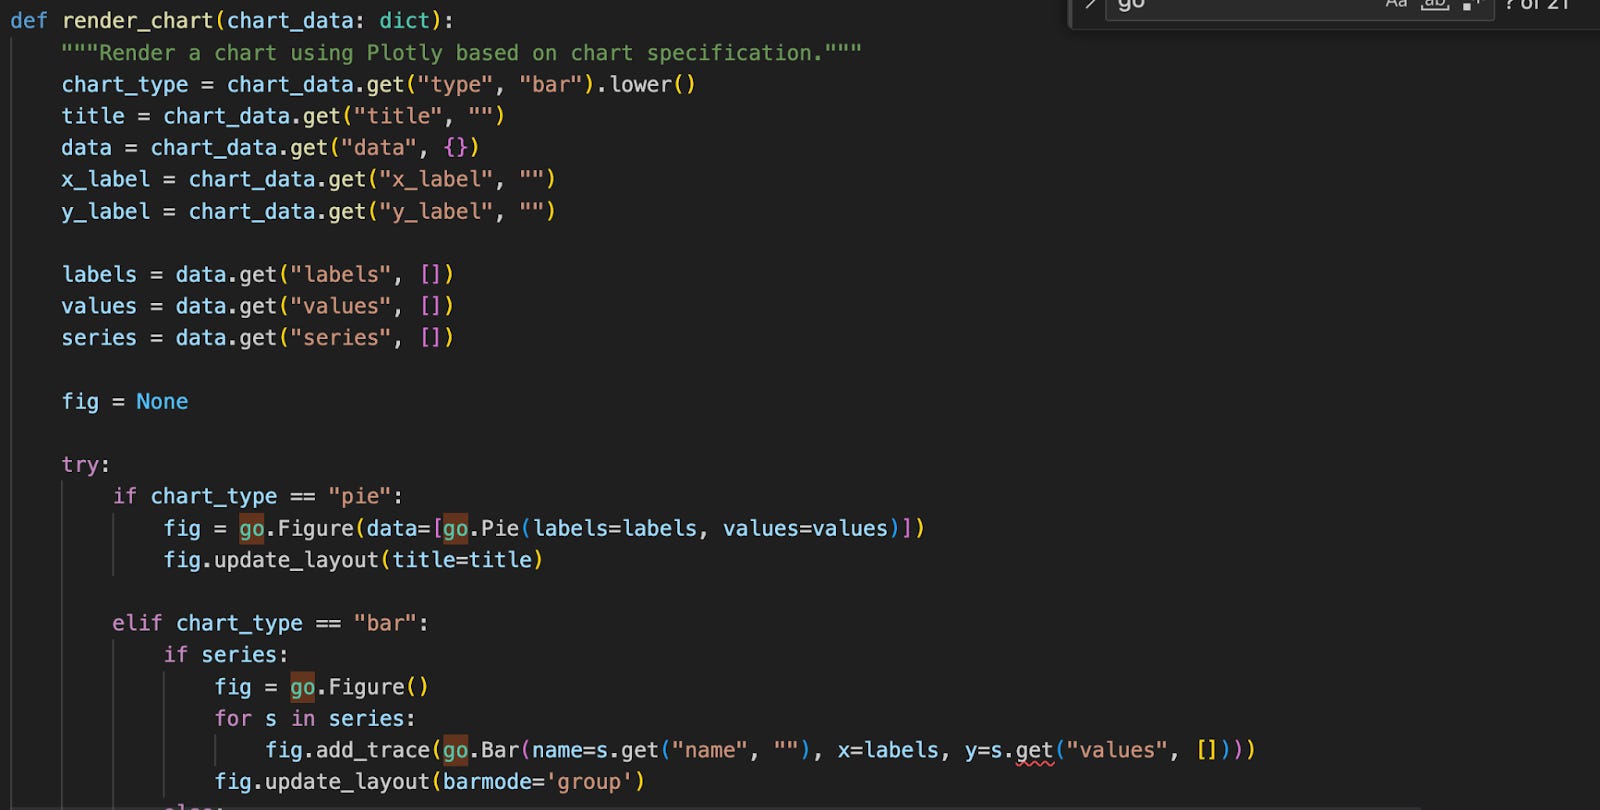
Where to look: The updated logic is located in streamlit/Main.py.
By separating the “intent” (in the prompt) from the “rendering” (in Streamlit), we maintain a clean separation of concerns while delivering a seamless user experience.
Conclusion
This experiment marks a significant step in making data truly accessible. By moving from simple text-based answers to dynamic BI visualizations, we’ve closed the loop between asking a question and gaining a visual insight.
The beauty of this approach lies in its governance. Because the AI is still grounded in the Cube semantic layer, the charts aren’t just “hallucinated” guesses—they are visual representations of verified business logic. Whether it’s a school administrator tracking student performance or a developer looking for a quick metric check, the interface provides a “hands-free” BI experience that stays accurate at scale.
What’s Next?
While this prototype demonstrates the power of combining RAG with Streamlit, there is still much to explore:
Embedded BI Dashboards: Moving beyond single charts to embed fully functional, pre-built dashboards (like those from Apache Superset) directly into the chat when a high-level overview is requested.
Advanced Interactivity: Allowing users to drill down into chart elements through further conversation or “chatting with the legend.”
Complex Multi-Step Reasoning: Improving how the agent handles requests that require joining multiple cubes or complex pre-aggregations.
We believe that the future of BI isn’t just a static dashboard; it’s a conversation that adapts to the user’s needs in real-time. We hope this project helps you kickstart your own journey into conversational analytics.
Join the Conversation
We’d love to hear your thoughts!
Did this setup work for your data?
Do you prefer a different library for parsing AI-generated charts?
What’s the biggest challenge you’ve faced with Text-to-Chart workflows?
Drop a comment below, or better yet, open an issue or PR on the GitHub repository.