
Superset MCP: Organizing Dashboard Metadata
How we use Superset MCP to keep complex dashboards structured, searchable, and easy to manage.

Introduction
At Ponder, we first introduced Airflow MCP and its plugin to make working with DAGs and pipelines smoother. But along the way, we realized something: managing Superset dashboards and their metadata can be just as challenging—if not more so.
Take education as an example. Schools and educational institutions manage dozens—sometimes hundreds—of dashboards tracking everything from student performance and attendance to resource allocation and budget utilization. Multiple BI developers work constantly on these dashboards, making frequent updates and refinements so stakeholders can access the most current data to improve education and help pupils succeed. The result? A powerful ecosystem of insights—but also an overwhelming maze of metadata.
Questions like “Who changed the attendance dashboard last week?”, “Which table powers our graduation rate metrics?”, or “What’s the data source behind this enrollment forecast?” can quickly become a time sink. And it’s not just schools—any organization with a complex BI environment faces the same challenge.
That’s why we built Superset MCP—so you can explore and manage Superset metadata through natural language, directly from your Claude code. No need to wrestle with the UI, no need to dig through layers of metadata. Just type your question, and get clear answers in plain language.
You can check out the project on GitHub, pull the image from Docker Hub, or install it from PyPI.
Quickstart
1. Run Superset Locally
If you don’t already have a Superset deployment but still want to try out Superset MCP, simply clone our GitHub repository and start it with Docker Compose:
git clone https://github.com/ponderedw/superset-mcp
cd superset-mcp
docker compose up
Once it’s up, open your browser and visit:
http://localhost:8088/Login credentials for the example environment:
Username: superset_admin
Password: superset
2. Using Superset MCP in Claude Desktop
Open Claude Desktop.
Navigate to: Settings → Developer → Edit Config.
Add the following entry to your MCP servers:
{
  “mcpServers”: {
    “superset”: {
      “args”: [
        “run”,
        “-i”,
        “--rm”,
        “-e”,
        “SUPERSET_API_URL”,
        “-e”,
        “SUPERSET_USERNAME”,
        “-e”,
        “SUPERSET_PASSWORD”,
        “pondered/superset-mcp:latest”
      ],
      “command”: “docker”,
      “env”: {
        “SUPERSET_API_URL”: “http://host.docker.internal:8088”,
        “SUPERSET_USERNAME”: “superset_admin”,
        “SUPERSET_PASSWORD”: “superset”
      }
    }
  }
}
Note: The Superset URL and credentials above match our local example environment.
Restart Claude Code.
3. Using Superset MCP with LangChain
To integrate with LangChain:
Install our PyPI package:
pip install superset-mcp-serverAdd the following MCP server configuration to your tools:
from langchain_mcp_adapters.client import MultiServerMCPClient
import os

mcps = {
    “SupersetMCP”: {
        “command”: “python”,
        “args”: [”-m”, “superset_mcp_server.mcp_server”],
        “transport”: “stdio”,
        “env”: {
            k: v for k, v in {
                “SUPERSET_API_URL”: os.getenv(”SUPERSET_API_URL”),
                “SUPERSET_USERNAME”: os.getenv(”SUPERSET_USERNAME”),
                “SUPERSET_PASSWORD”: os.getenv(”SUPERSET_PASSWORD”),
            }.items() if v is not None
        }
    }
}

client = MultiServerMCPClient(mcps)
mcp_tools = await client.get_tools()
Now you’re ready to simply ask questions about your Superset instance in natural language—and let MCP handle the rest!
Talking to Superset MCP
Let’s connect to our example Superset deployment and build a simple dashboard using the data automatically ingested into our Postgres database.
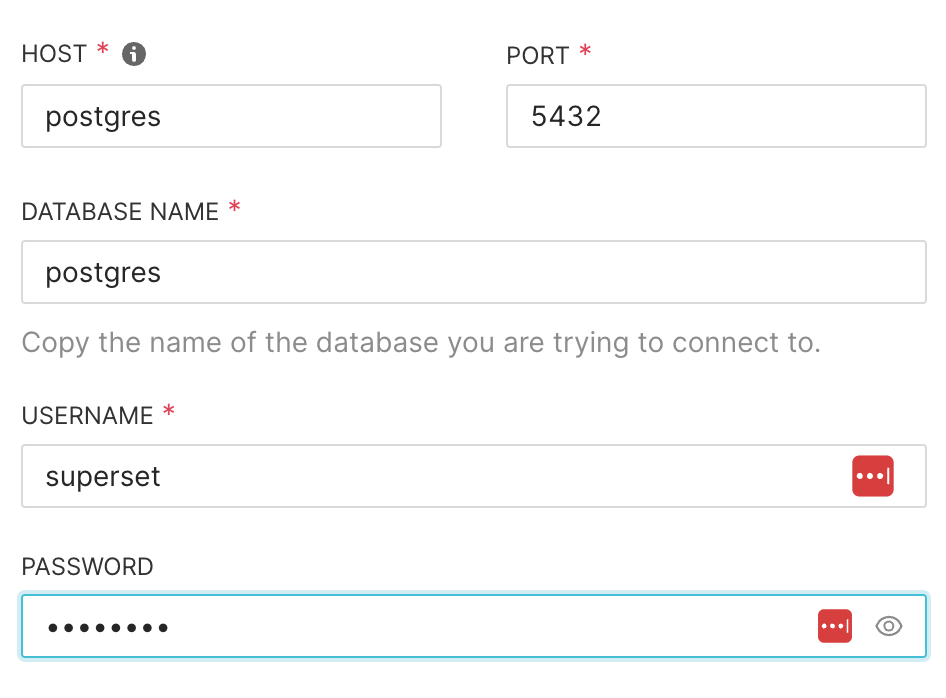
First, we’ll add a database connection — specify “postgres” as both the host and the database name, and use “superset” for the login and password.
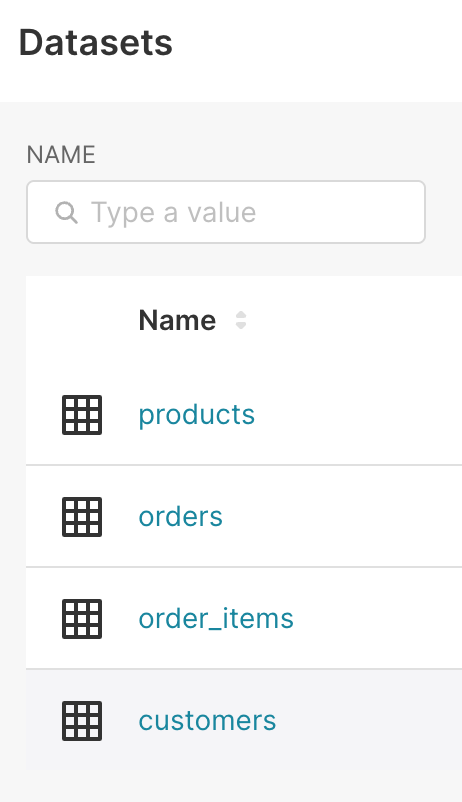
Once connected, we can create a few simple charts from the database tables and organize them into an E-commerce Performance Dashboard.
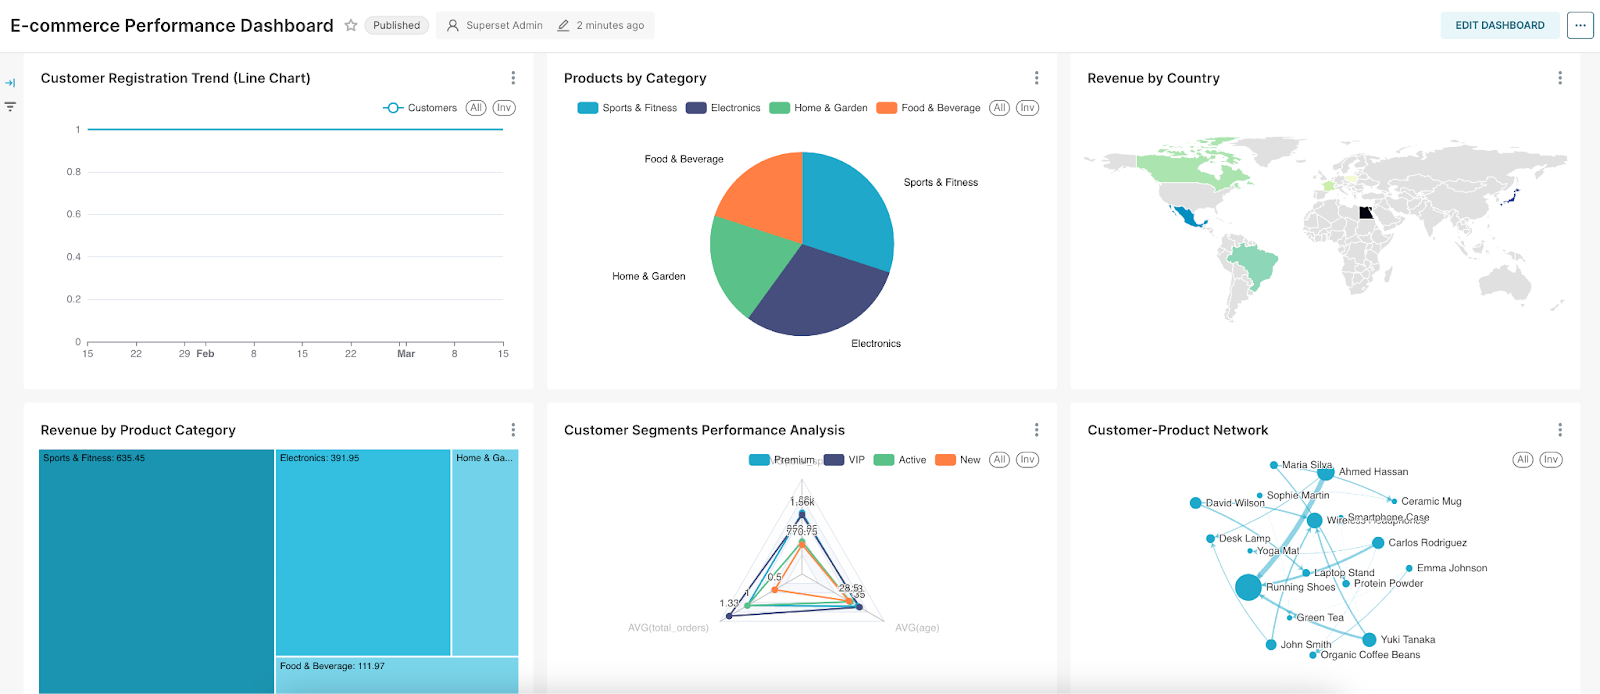
Finally, don’t forget to publish your dashboard so it’s ready to use!
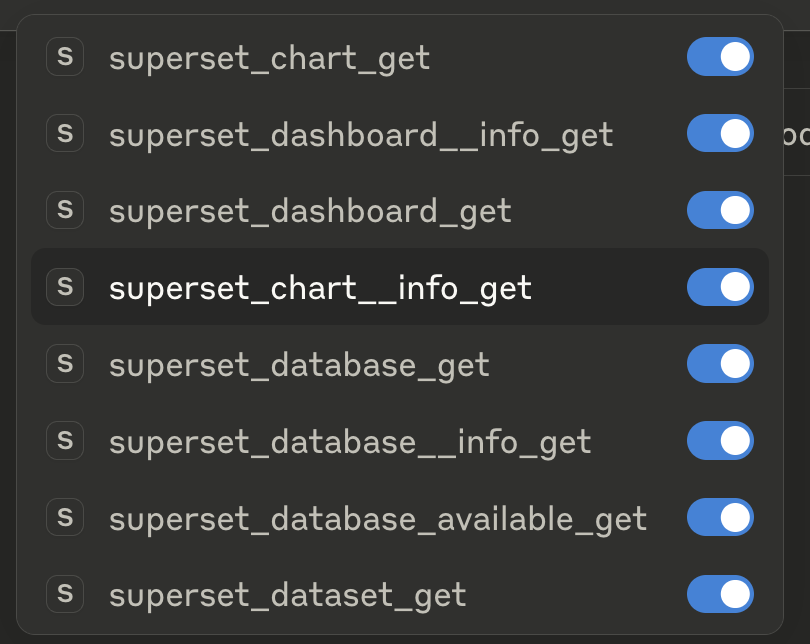
You can explore all the available tools in Claude Desktop — and more will be coming soon.
Now, let’s start asking some interesting questions:
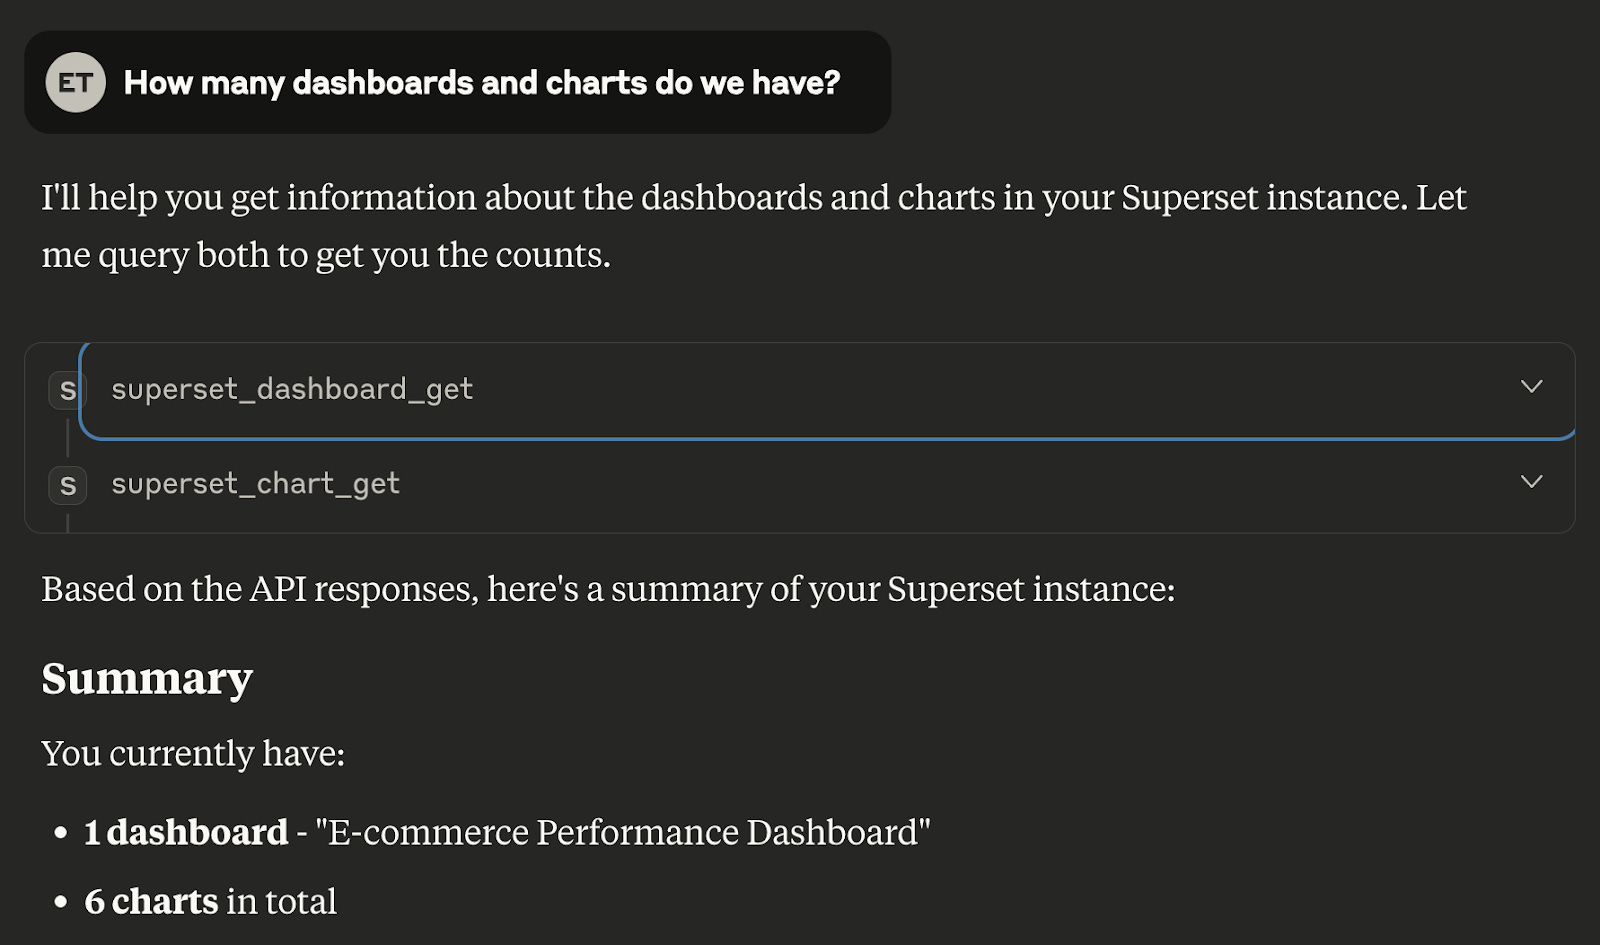
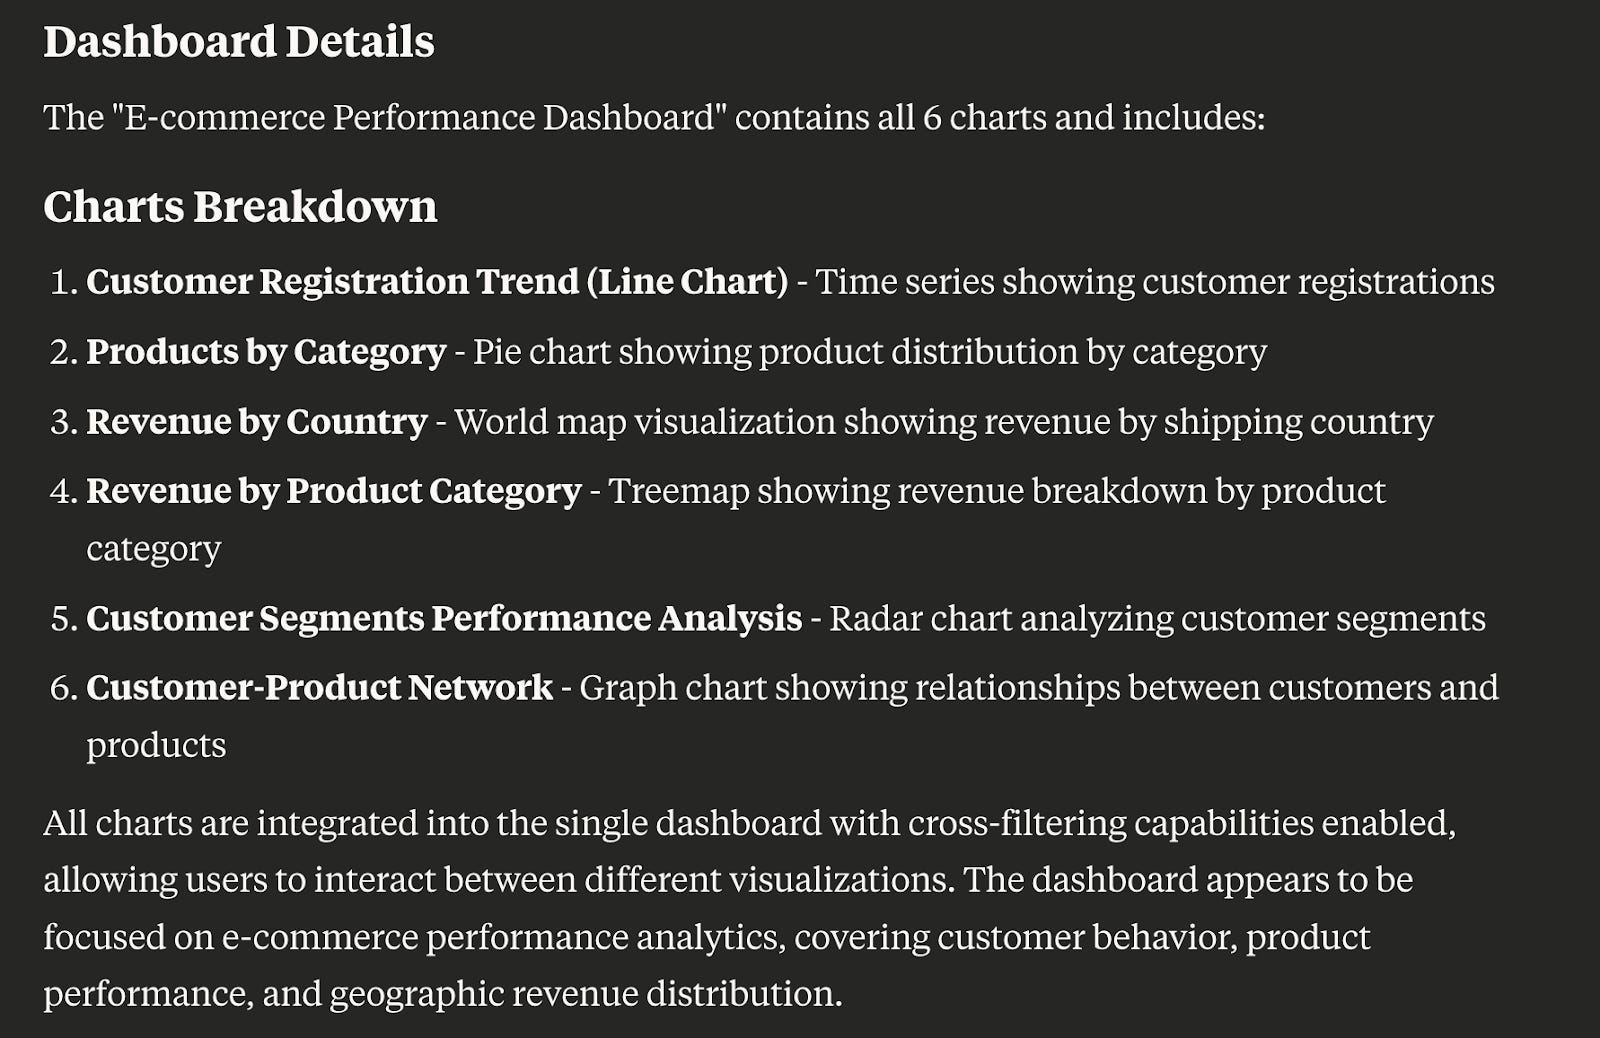
How many dashboards and charts do we have?
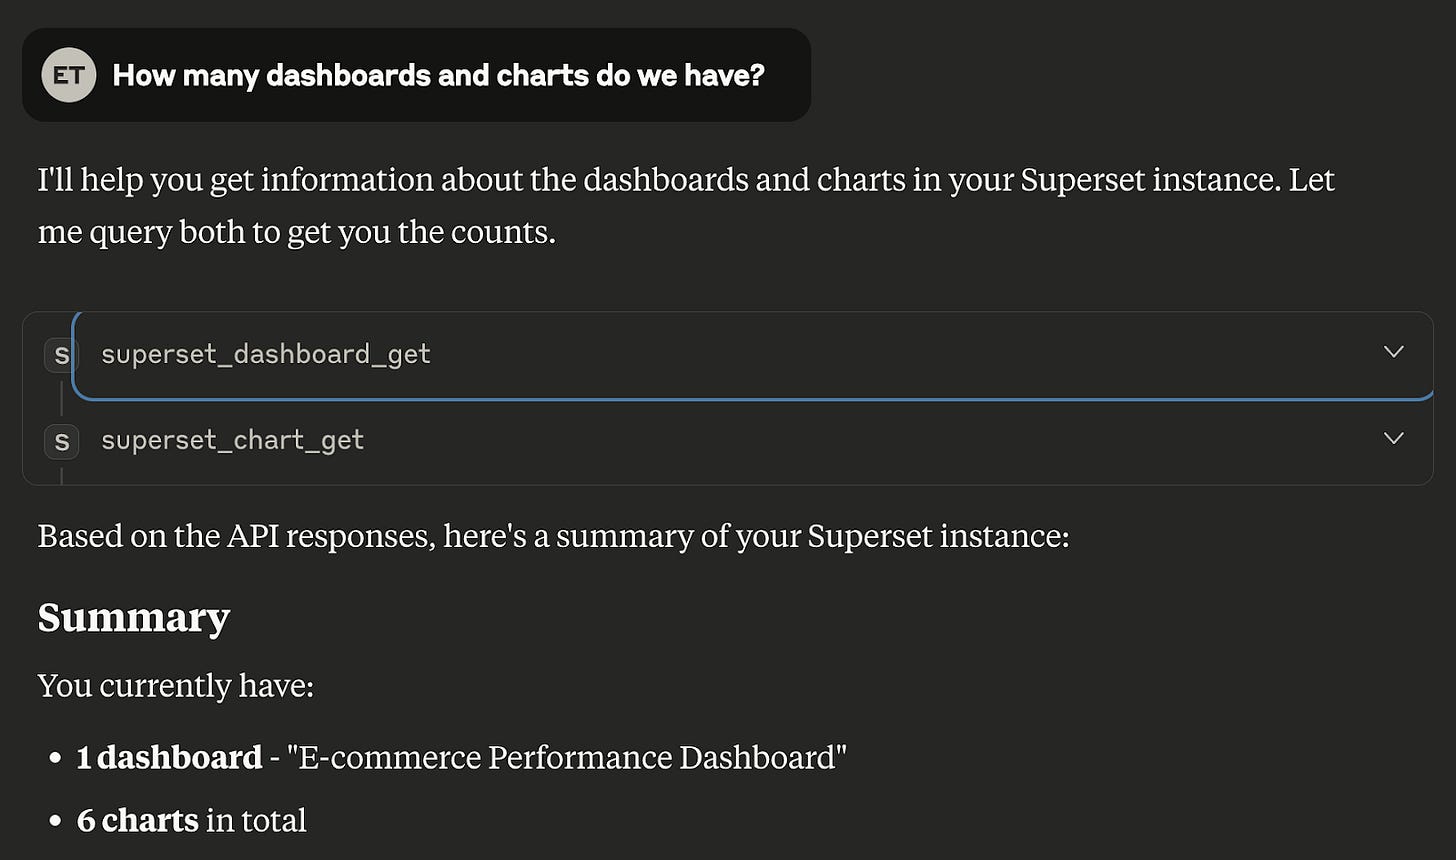

Great! We get the exact number of dashboards and charts in our environment.
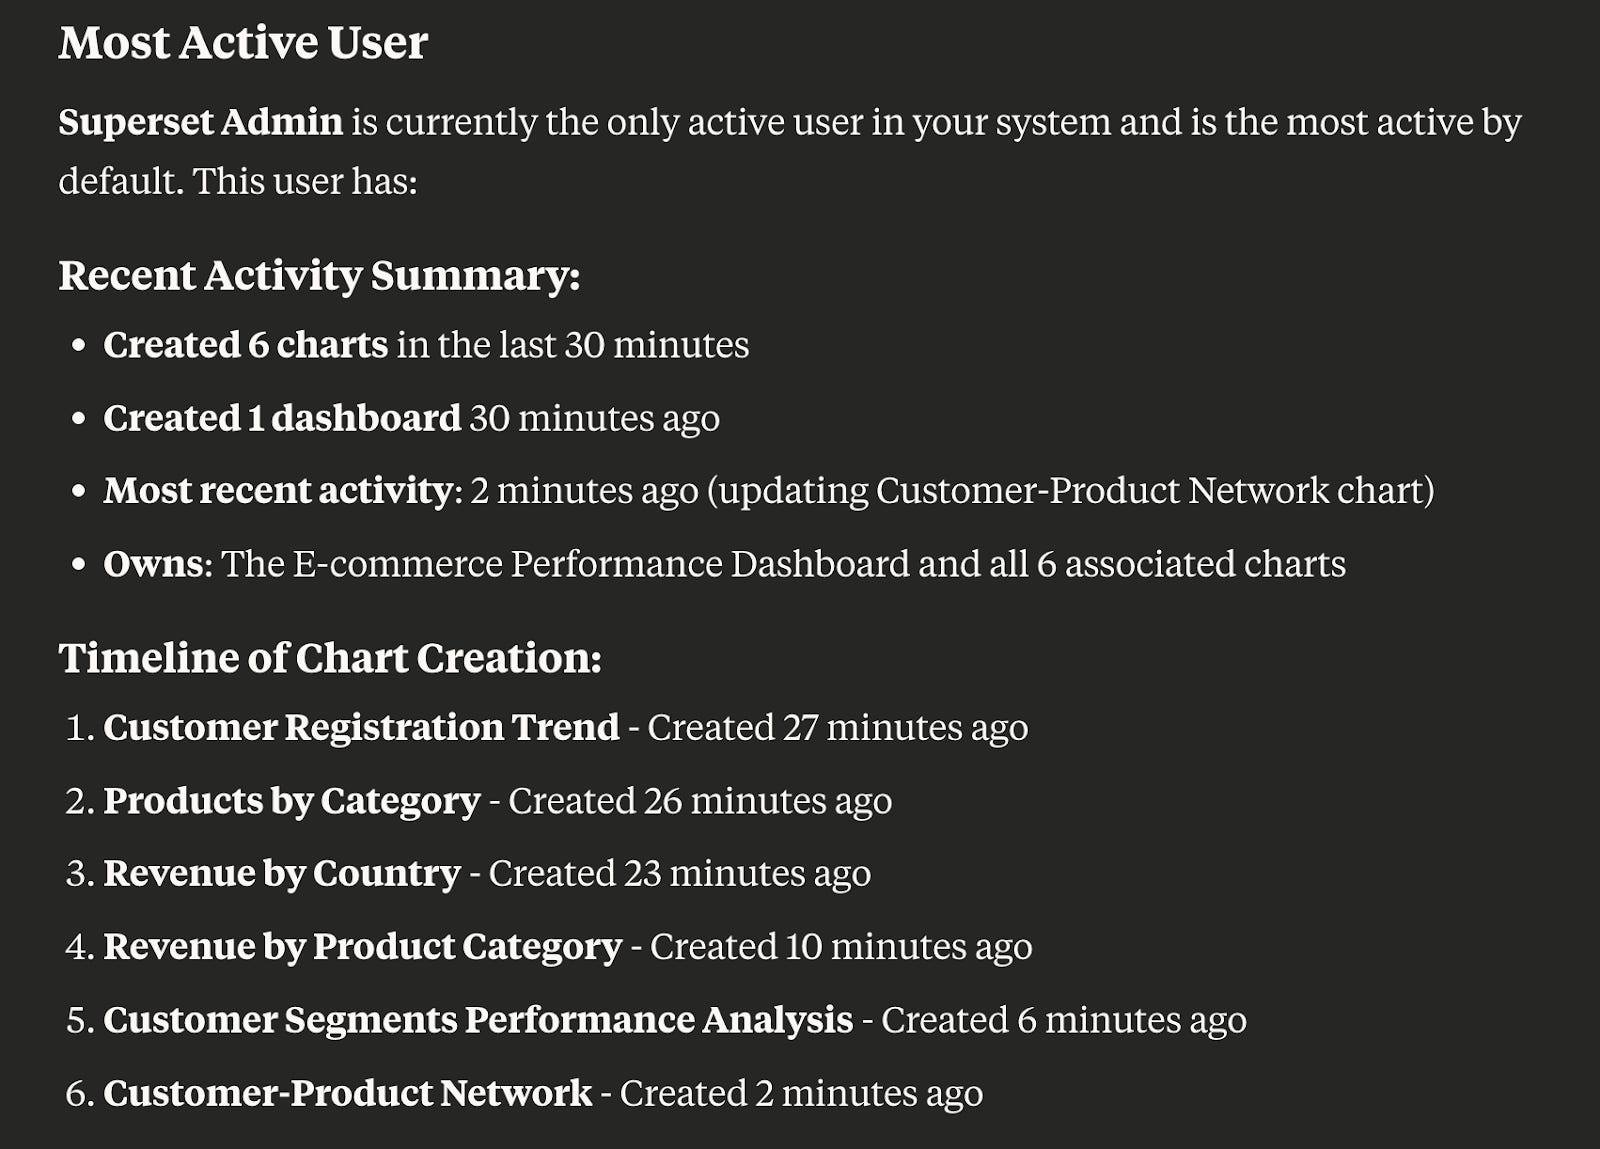
Who are the most active users?
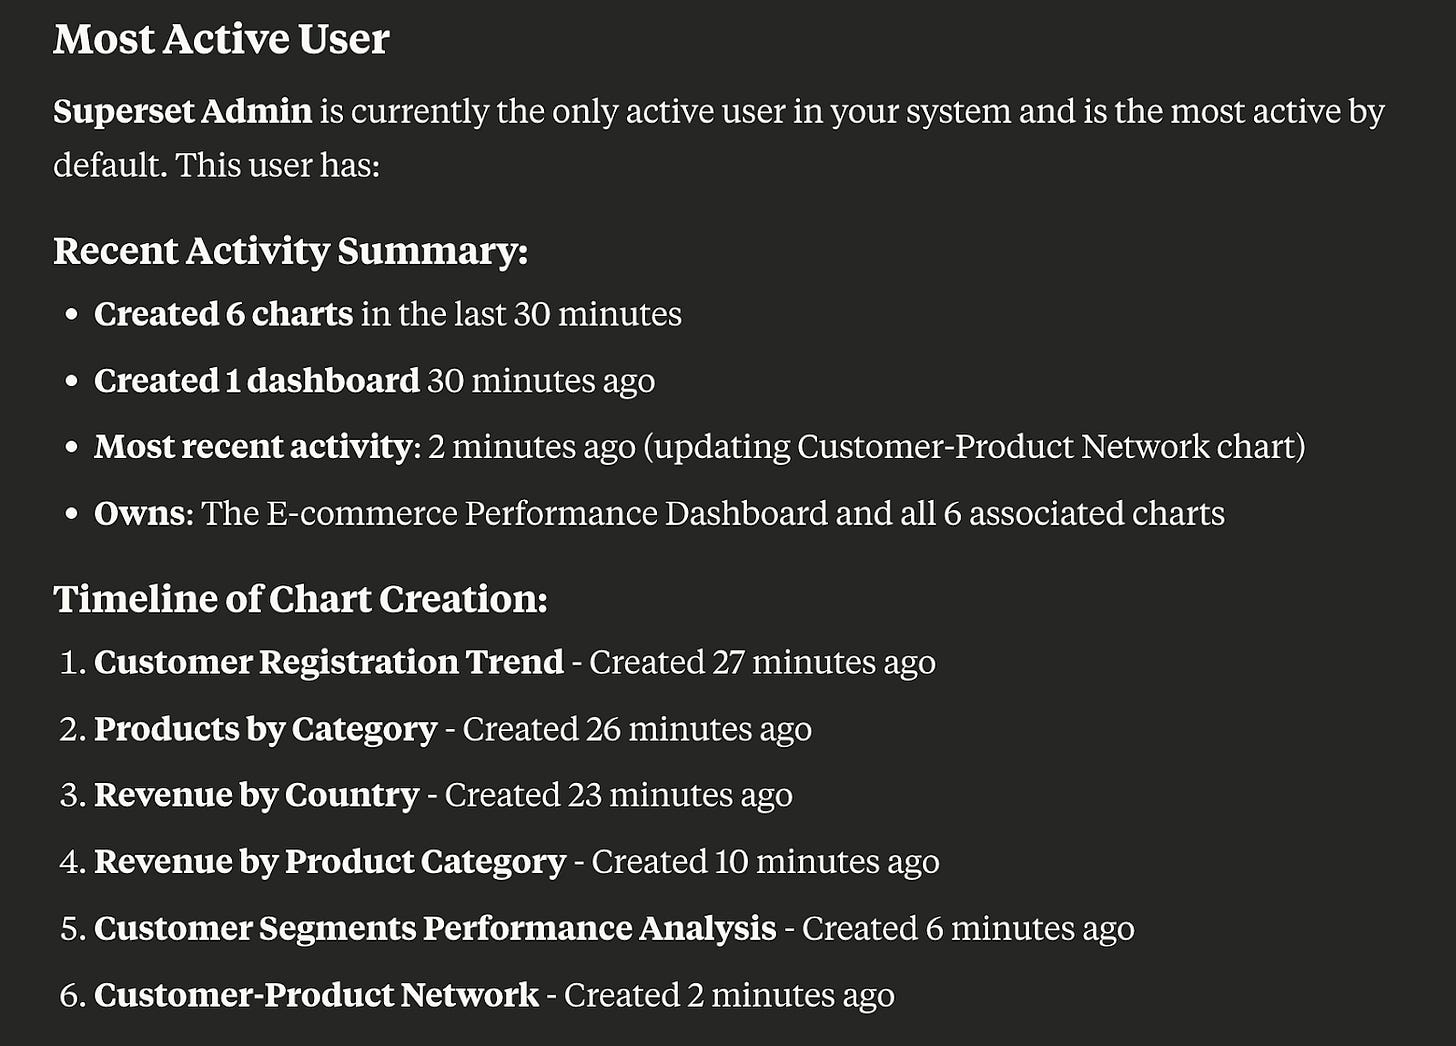
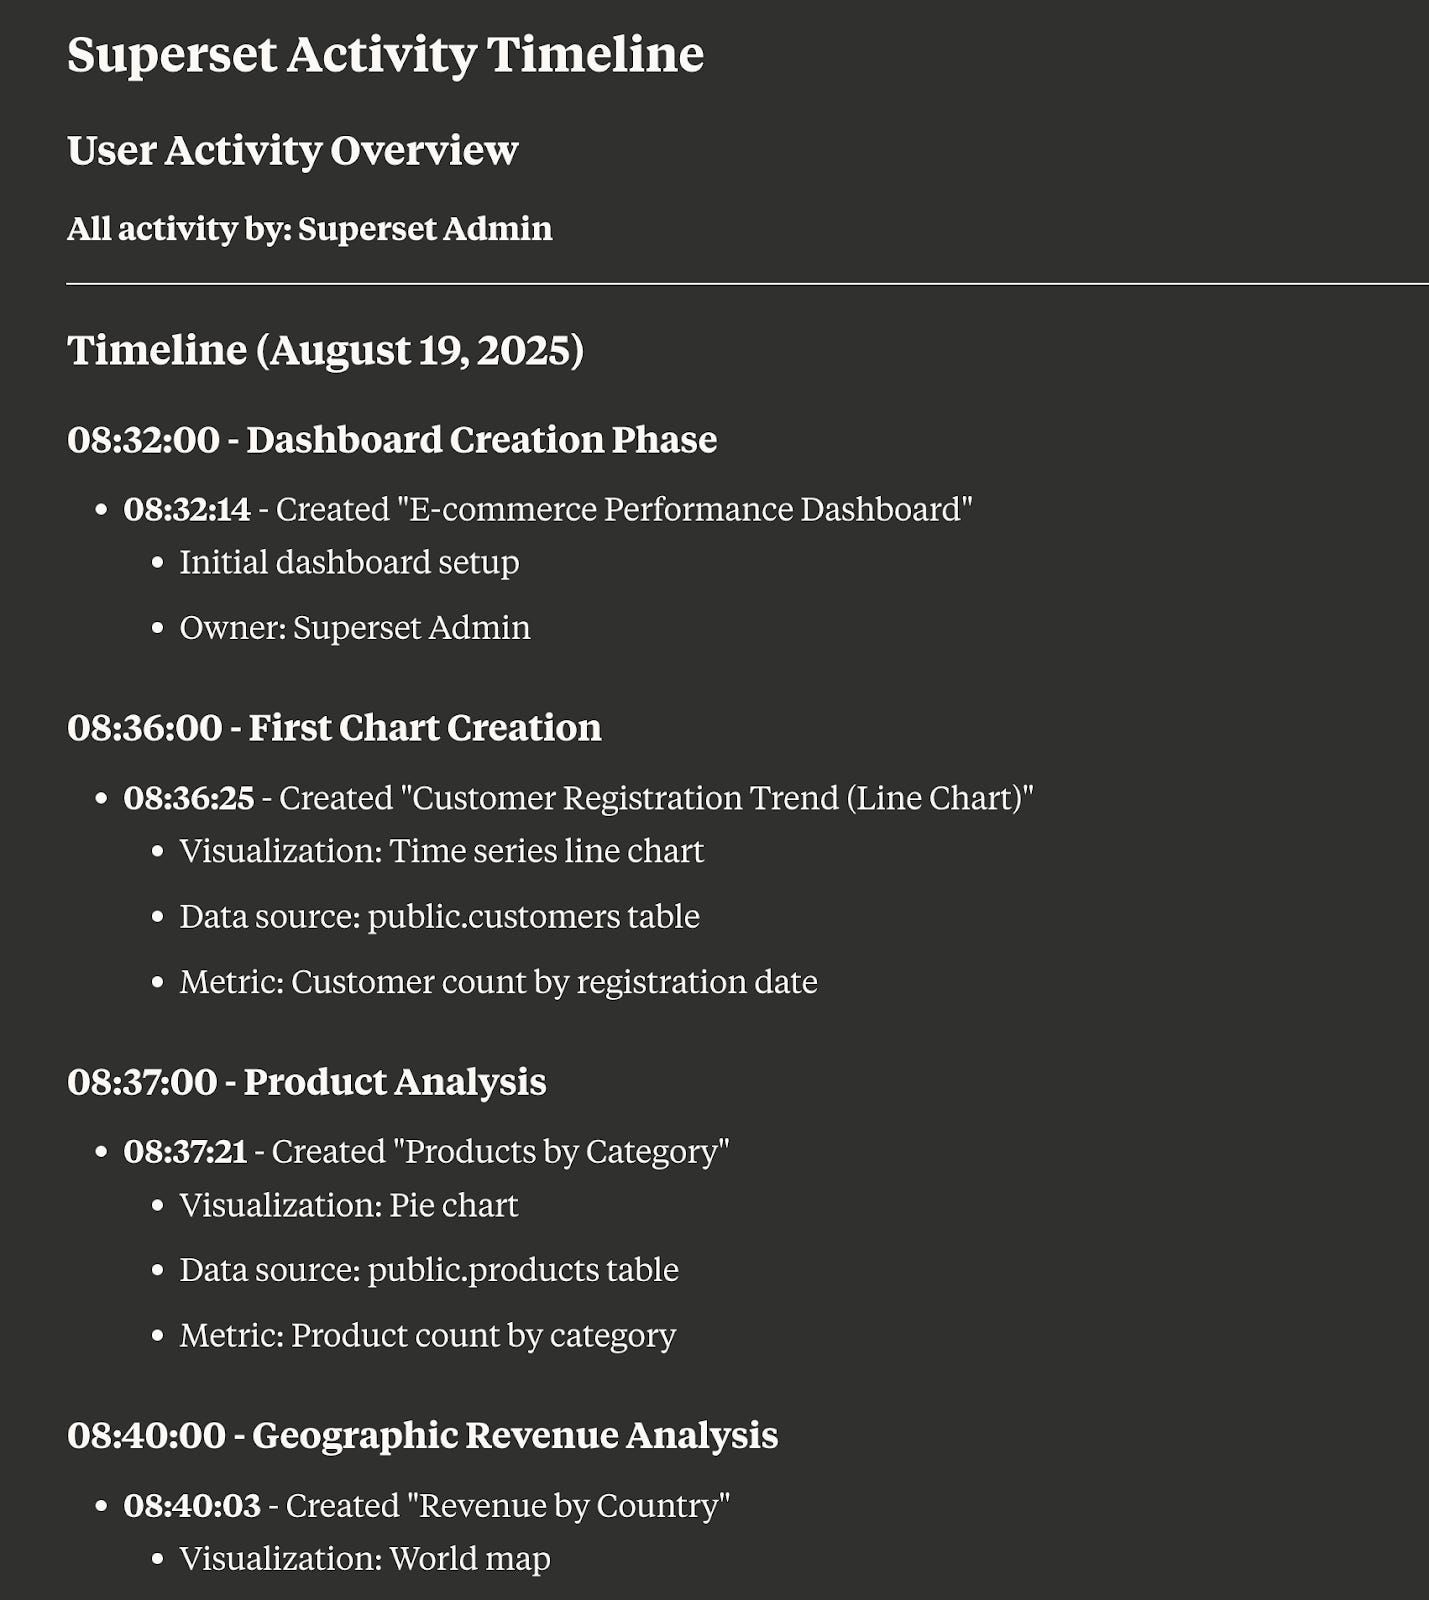
Perfect — not only do we see the top active user, but we also get an Activity Timeline, which makes it much easier to understand what’s happening in our cluster.

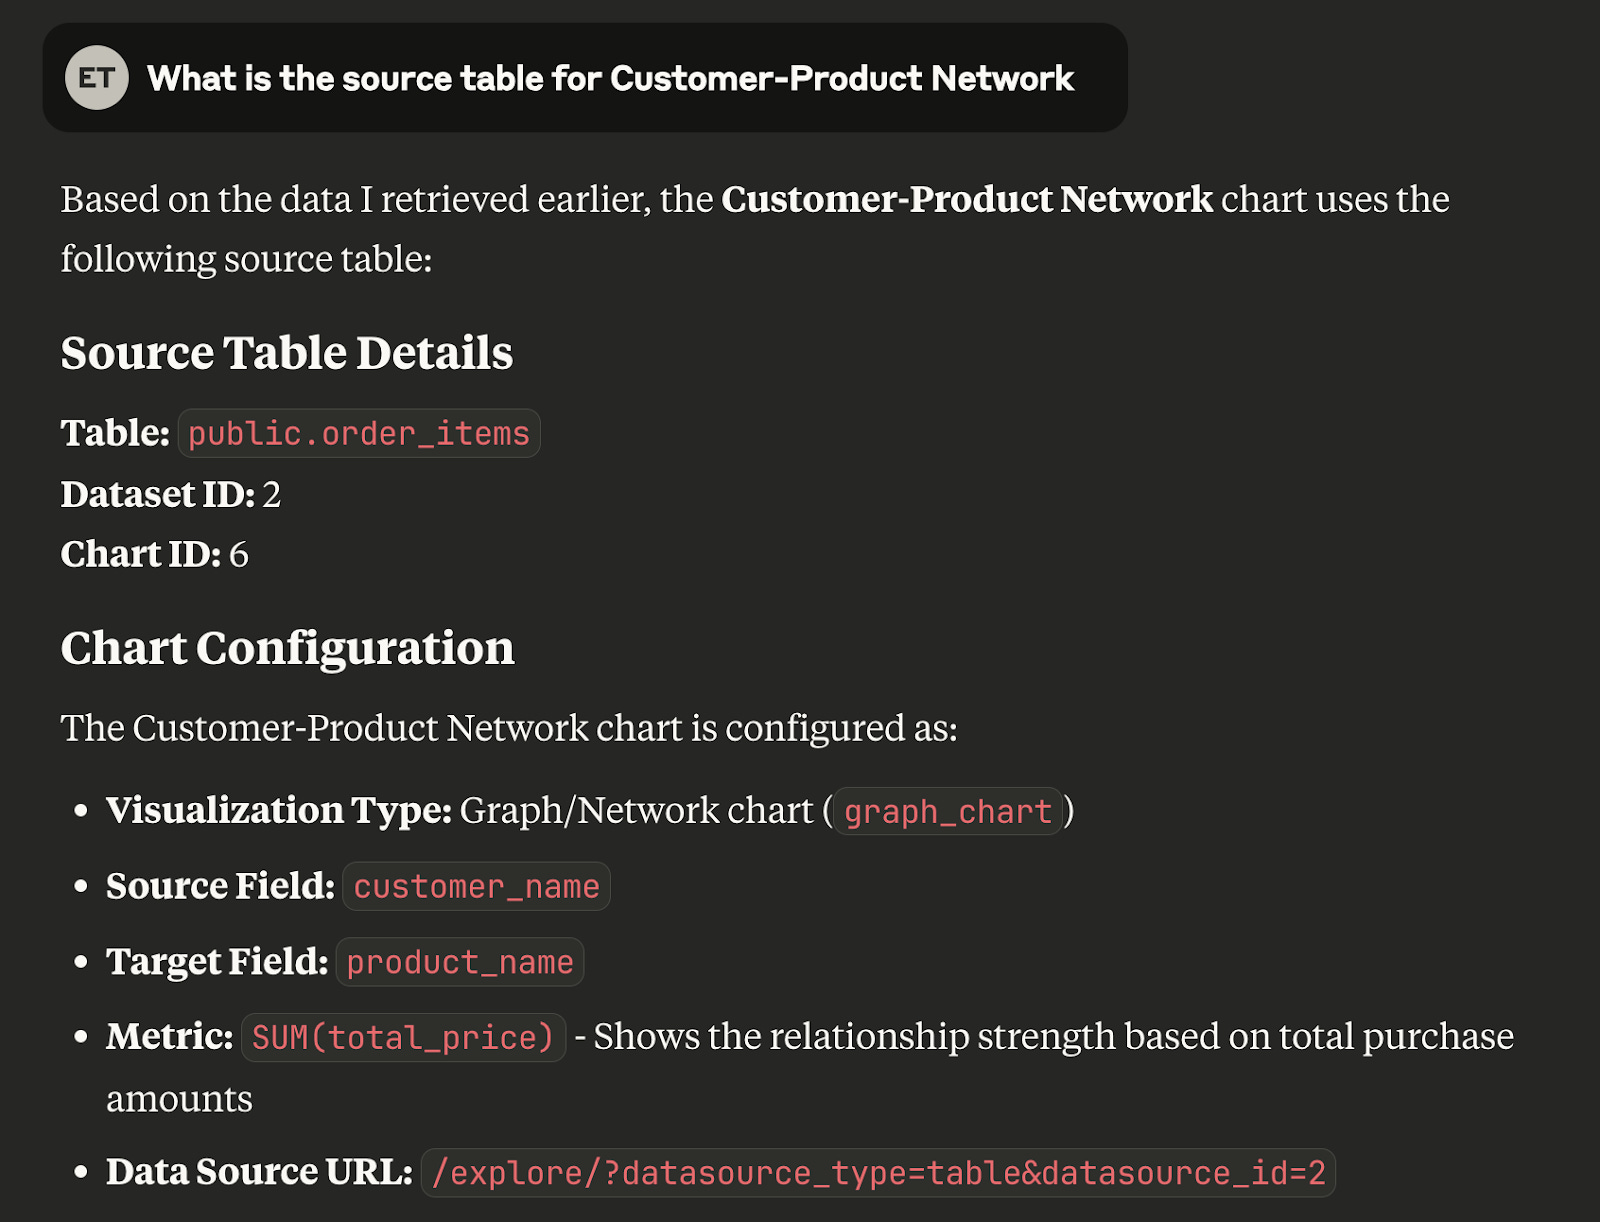
What is the source table for Customer-Product Network?

Excellent — we now have the precise database object name.
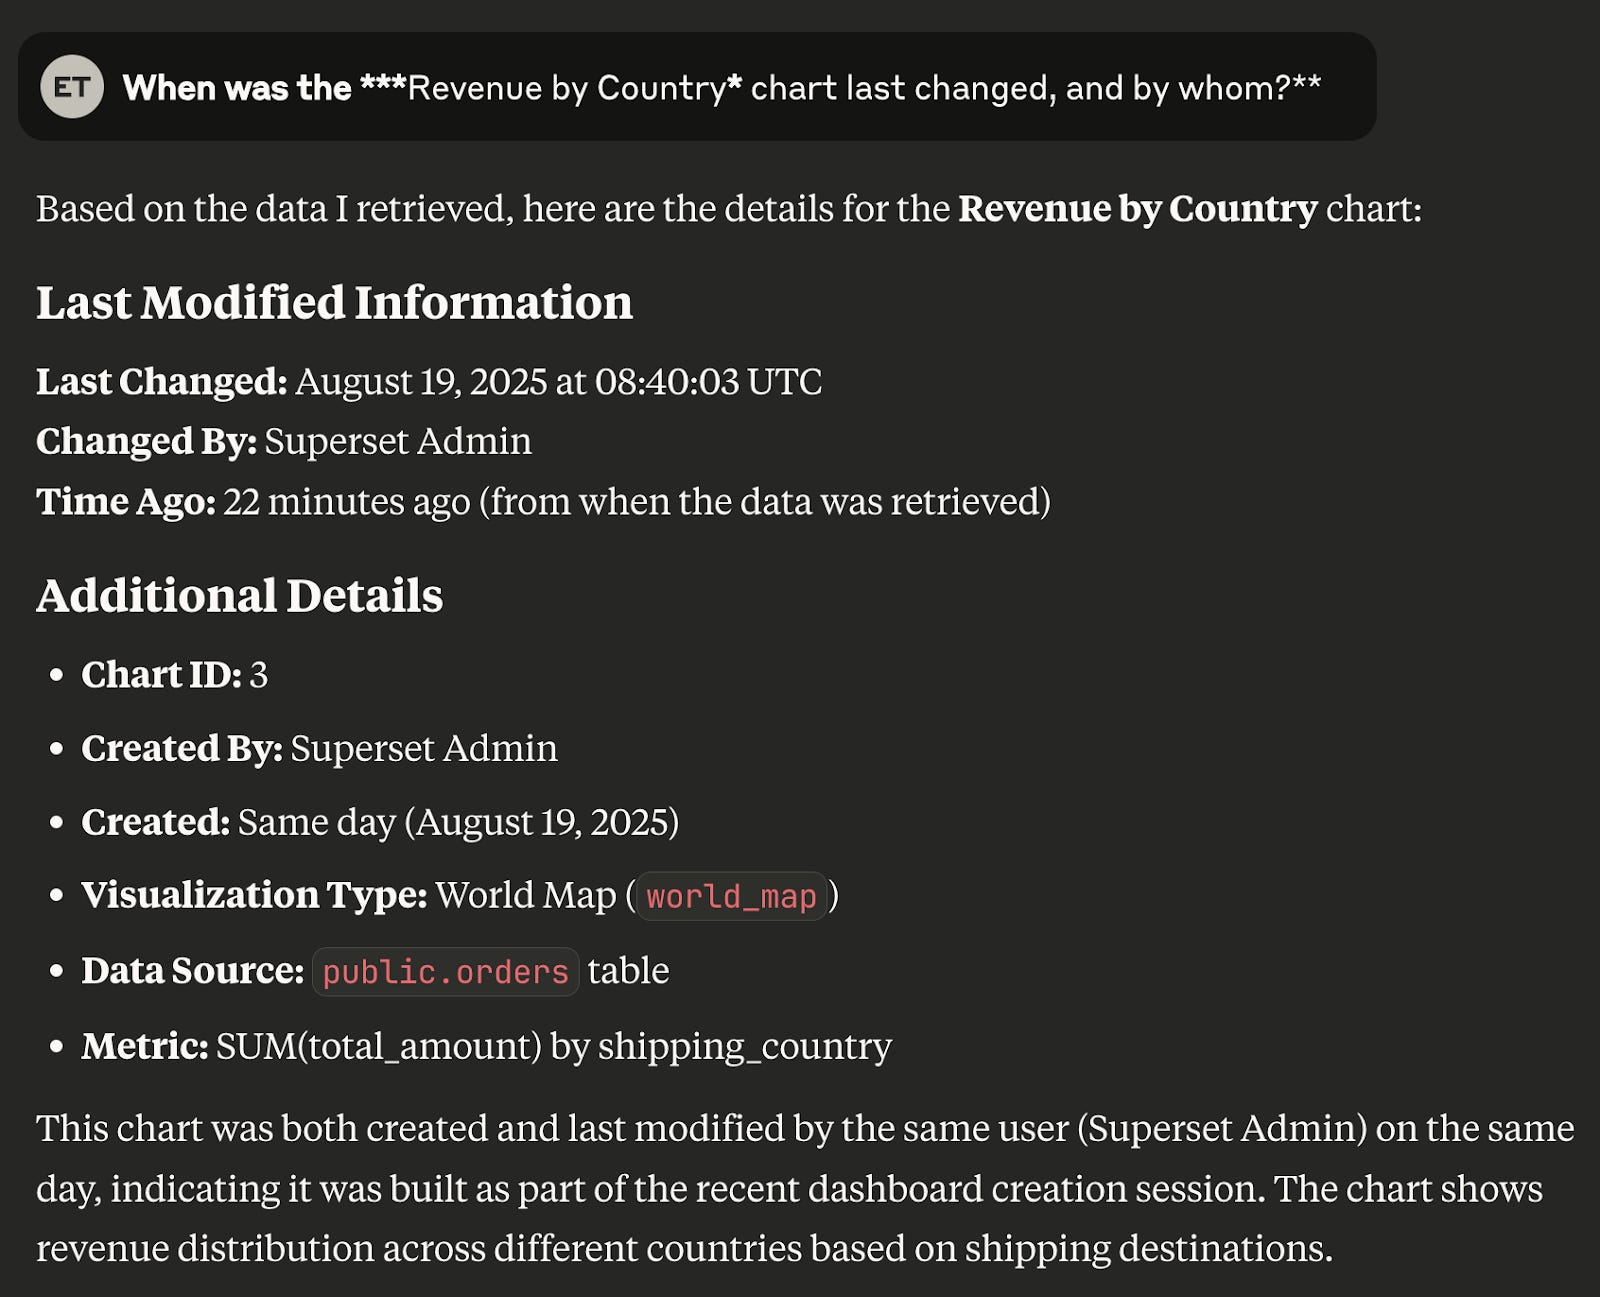
When was the Revenue by Country chart last changed, and by whom?
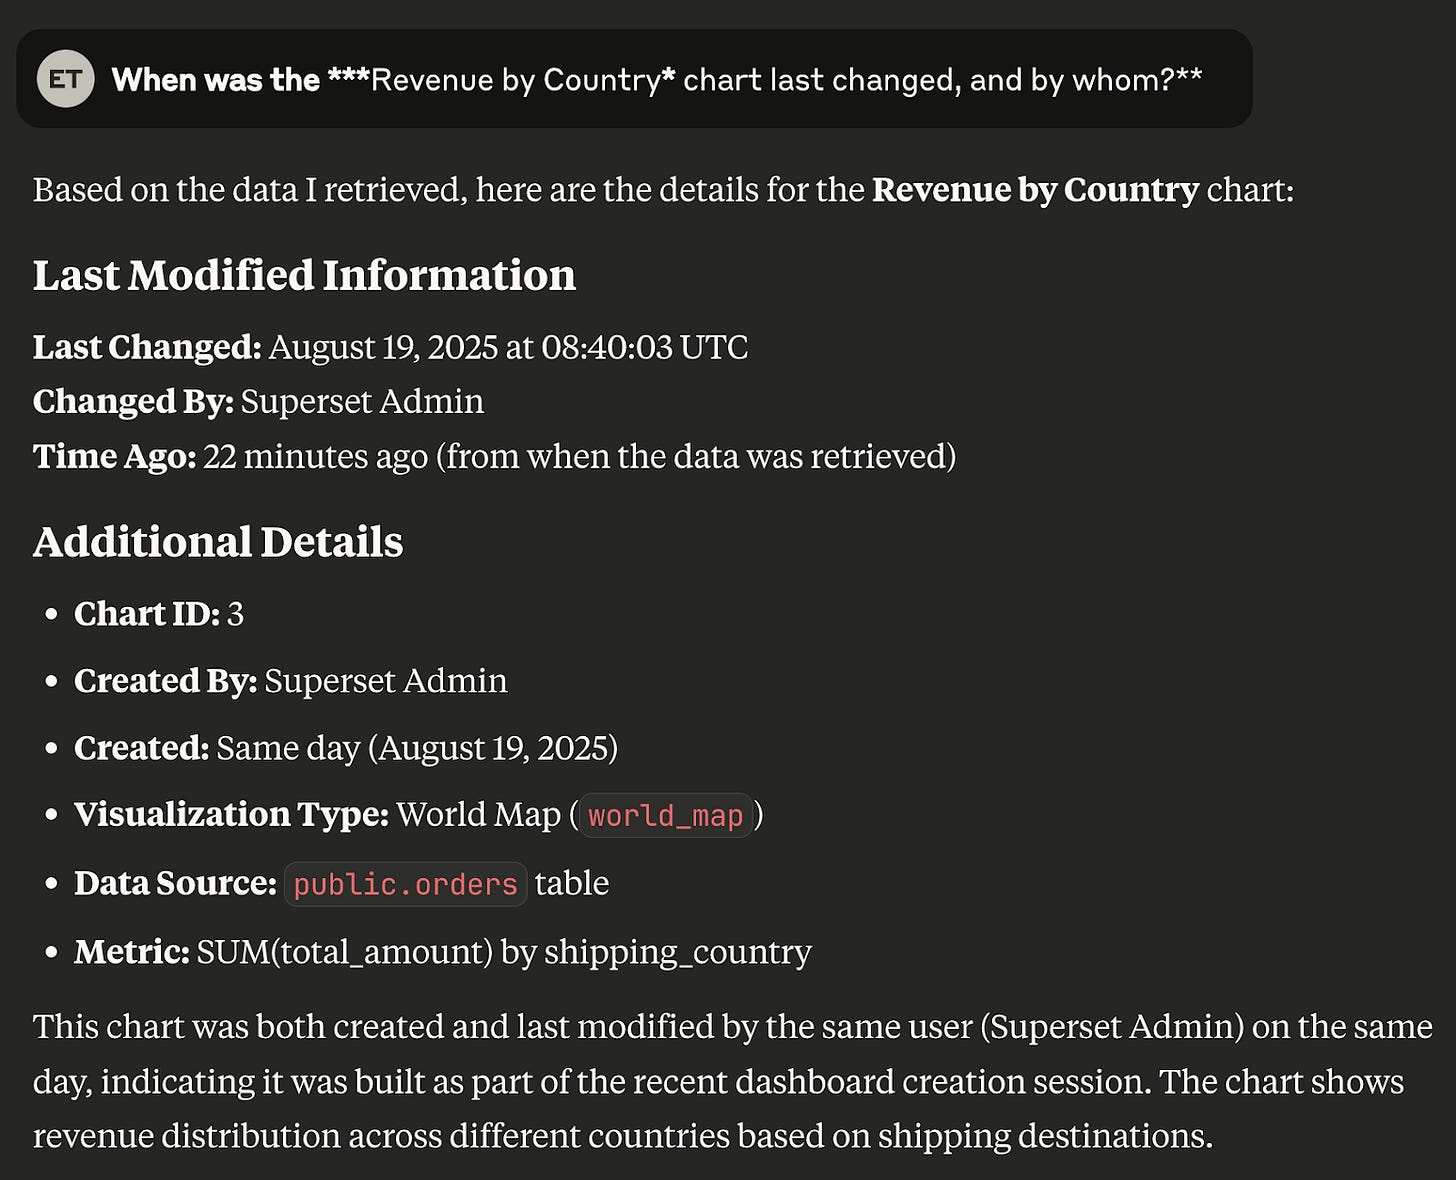
Spot on — we’ve got the correct answer here as well.
Pretty cool, right? Keep exploring and help us uncover even more capabilities of Superset MCP!
Conclusion — Managing Metadata the Smart Way
Superset MCP turns the often painful task of navigating dashboard metadata into a fast, intuitive conversation. Whether you’re an educational administrator tracking changes to student performance dashboards, a data analyst identifying which tables feed into critical reports, or a team lead trying to understand who’s been most active in your BI environment—you can now skip the clicks, menus, and manual searches. Just ask in plain language, and get precise, actionable answers.
In education settings where BI teams constantly update dashboards to provide stakeholders with real-time insights for improving outcomes, Superset MCP becomes invaluable. But the benefits extend far beyond schools—any business with complex dashboard environments, whether in healthcare, finance, retail, or manufacturing, can leverage this natural language interface to cut through the metadata complexity.
Because it works entirely through natural language, you can easily delegate these tasks to analysts, project managers, principals, department heads, or any non-technical users—empowering more people in your team to get the information they need without relying on developers or admins.
We’re excited to see how the community will use Superset MCP—and we’d love your feedback. Try it out, share your ideas, and help us shape the next set of capabilities.
🔗 Resources: