

The graphify post ended with a CI job that rebuilt the graph on every merge to develop and committed graphify-out/ back to the repo. It worked for about a week before it started getting in the way.
A generated graph in git has two problems. It’s stale the moment you run dbt compile locally, because the committed version describes develop, not your branch. And it turns every merge into a second commit full of JSON diffs nobody reads, which is noise in exactly the history you’d want to search later. Git is the right place for the code that produces the graph. It’s the wrong place for the graph.
So we took graphify-out/ out of the repo and replaced the commit step with two things:
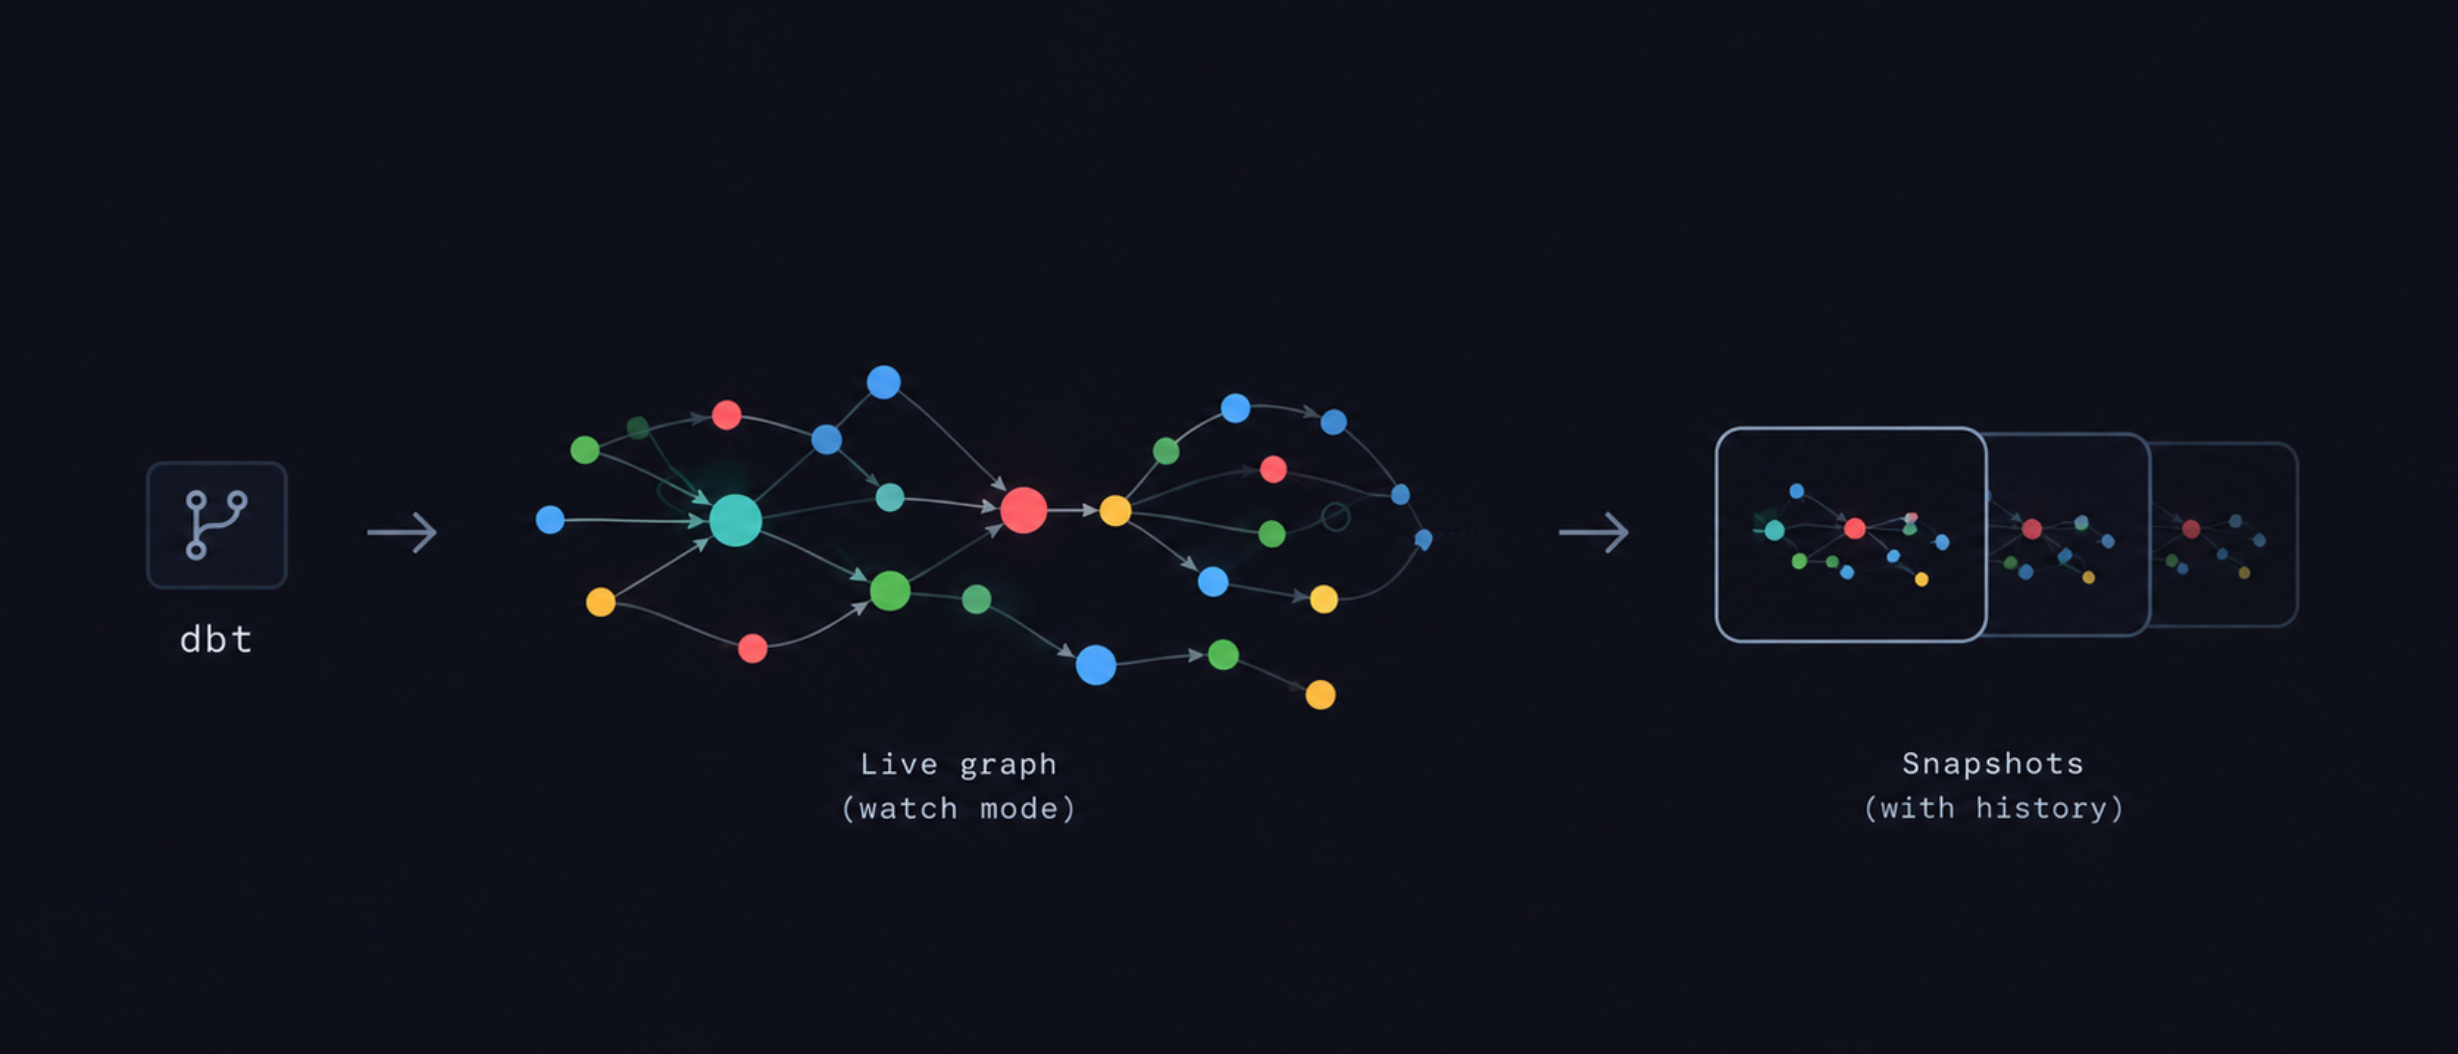
Watch mode rebuilds the graph whenever dbt rewrites the manifest, so it always describes the branch you’re on.
Snapshots keep every past version of the graph, tied to the git commit it was built from.
This post wires both into the Coder workspace from the earlier post, so every developer gets an up-to-date lineage graph without thinking about it. At the end, there’s a look at where this goes next: shipping those snapshots to S3, so an agent can answer “what changed?” from outside your workspace.
Watch Mode: The Graph Updates Itself
Start it once, and every time dbt rewrites manifest.json — dbt run, dbt compile, dbt parse, even dbt ls — the graph gets rebuilt:
bash
dbt-graphify dbt_project/target/manifest.json \
  --out graphify-out \
  --watch
The watcher polls the manifest’s modification time every two seconds. When it changes, it rebuilds the graph and then takes a snapshot (more on those below). If a rebuild fails — say dbt was halfway through writing the manifest — it logs the error and keeps watching rather than dying. Ctrl-C stops it.
Add graphify-out/ to .gitignore. The watcher is now the only thing that writes it.
Adding It to the Coder Template
If you followed the Coder + dbt post, you already have a coder_template.tf whose startup script clones the repo, sets up the Python environment, and runs dbt before the workspace is handed to you. That startup script is where dbt-graphify goes: install it, then start the watcher in the background. Nobody has to remember to do either.
First, pin the version in a locals block, so the whole team upgrades together by changing one line of the template — the same standardization-drift fix from the Coder + Airflow and Coder + dbt posts:
locals {
  dbt_graphify_version = "0.1.12"
}
Then add the install to the startup script. It checks the installed version first, so restarting a workspace doesn’t reinstall every time, and an install failure doesn’t stop the rest of the workspace from coming up:
_dbt_gfy_want="${local.dbt_graphify_version}"
_dbt_gfy_installed=$(dbt-graphify --version 2>/dev/null || true)
if [ "$_dbt_gfy_installed" != "$_dbt_gfy_want" ]; then
  echo "Installing dbt-graphify $_dbt_gfy_want..."
  pipx install --force "dbt-graphify==$_dbt_gfy_want" \
    || echo "dbt-graphify install failed, continuing..."
  pipx install graphifyy || echo "graphify install failed, continuing..."
else
  echo "dbt-graphify $_dbt_gfy_want already installed, skipping."
fi
dbt-graphify builds the graph; graphifyy is what Claude uses to query it.
And start the watcher, after the step that runs dbt:
if command -v dbt-graphify >/dev/null 2>&1; then
  DBT_GFY_MANIFEST="$DBT_PROJECT_DIR/target/manifest.json"
  DBT_GFY_OUT="$REPO_DIR/graphify-out"
  DBT_GFY_LOG="$HOME/.cache/dbt-graphify-watch.log"
  DBT_GFY_PID_FILE="$HOME/.cache/dbt-graphify-watch.pid"

  # Kill any leftover watcher from a previous workspace start
  if [ -f "$DBT_GFY_PID_FILE" ]; then
    kill "$(cat "$DBT_GFY_PID_FILE")" 2>/dev/null || true
    rm -f "$DBT_GFY_PID_FILE"
  fi

  mkdir -p "$(dirname "$DBT_GFY_LOG")"
  PYTHONUNBUFFERED=1 nohup dbt-graphify "$DBT_GFY_MANIFEST" --out "$DBT_GFY_OUT" --watch \
    > "$DBT_GFY_LOG" 2>&1 &
  echo $! > "$DBT_GFY_PID_FILE"
  echo "✓ dbt-graphify watch started (log: $DBT_GFY_LOG, out: $DBT_GFY_OUT)"
else
  echo "dbt-graphify not found, skipping watch."
fi
Killing the old process first means restarting the workspace always leaves exactly one watcher running. If the manifest doesn’t exist yet — a fresh workspace where dbt hasn’t compiled — the watcher waits for the first dbt compile to create it rather than failing.
Checking on it:
tail -f ~/.cache/dbt-graphify-watch.log         # what it's doing
ps -p "$(cat ~/.cache/dbt-graphify-watch.pid)"  # whether it's alive
You don’t need anything else for Claude to find the graph. dbt-graphify writes a CLAUDE.md block telling Claude Code to use graphify query for lineage questions instead of grepping SQL files (covered in the graphify post), and the watcher keeps the graph that block points to current. From then on, the workflow is: run dbt, ask Claude.
Snapshots: The DAG Has a History Now
Every rebuild also archives the graph into a timestamped folder named after the current git commit:
graphify-out/
  graph.json                          ← current graph (overwritten each rebuild)
  lineage.json
  GRAPH_REPORT.md
  index.json                          ← all snapshots, newest first
  2026-10-25T1430Z_a5547d5/           ← snapshot: UTC timestamp + short HEAD SHA
    graph.json
    lineage.json
    GRAPH_REPORT.md
    meta.json
The meta.json is what makes a snapshot useful, not just a copy. It records which commit the graph was built from, the previous snapshot, and every commit between the two:
{
  "snapshot_id": "2026-10-25T1430Z_a5547d5",
  "head_sha": "a5547d5bef...",
  "base_sha": "8f00c50519...",
  "previous_snapshot": "2026-10-24T0900Z_8f00c50",
  "timestamp": "2026-10-25T14:30:00+00:00",
  "commits": [
    {
      "sha": "a5547d5bef",
      "author": "Egor Tarasenko",
      "date": "2026-10-25T14:28:00+02:00",
      "message": "feat: add attendance to student_retention_analysis"
    }
  ],
  "nodes_count": 63,
  "edges_count": 141
}
So “what did the DAG look like before we refactored retention?” stops being archaeology. It has an answer: a specific snapshot, built from a specific commit.
Snapshots also work without the watcher:
dbt-graphify snapshot graphify-outAnd to see what you have:
jq -r '.[] | "\(.snapshot_id) \(.nodes_count) nodes"' graphify-out/index.jsonWhere It Stops
A few honest limits before you build a workflow around this:
Column-level lineage still isn’t there. Same gap as in the graphify post. Ask about a model and the graph answers; ask about a specific column and Claude still has to read the SQL.
Local snapshots pile up. The watcher snapshots on every rebuild, and there’s no pruning yet. A day of dbt runs on the same commit means a day of near-identical folders. It’s all gitignored and cheap, but if disk matters in your workspace, clear old folders now and then.
A snapshot needs git. Snapshot IDs and meta.json come from git log. Run it outside a git checkout and the snapshot fails (the graph still rebuilds).
History starts the day you turn it on. Snapshots don’t backfill. Questions about the DAG before your first snapshot still need git checkout and a rebuild.
What’s Next: Snapshots Outside the Workspace
Everything above lives in one developer’s workspace. That’s the right place for “what breaks if I change this model?” — you’re asking about your own branch, right now.
It’s the wrong place for the questions you ask when something has already broken. A mart starts returning wrong numbers, a nightly run fails, a dashboard goes blank. Then the question isn’t about your branch; it’s about what got merged:
“Did any dbt changes get deployed today, and how many nodes did they touch?”
“What changed in the DAG between yesterday and today?”
“Which commit added this dependency?”
The pieces for that are already in dbt-graphify, and we’re testing them now. CI builds a snapshot from every merge to the default branch and uploads it to S3 (dbt-graphify upload). An MCP server reads that S3 history and gives Claude tools to list snapshots, diff any two of them, and resolve a commit SHA to the graph built from it. Here’s the first question above, asked against our own snapshot history:
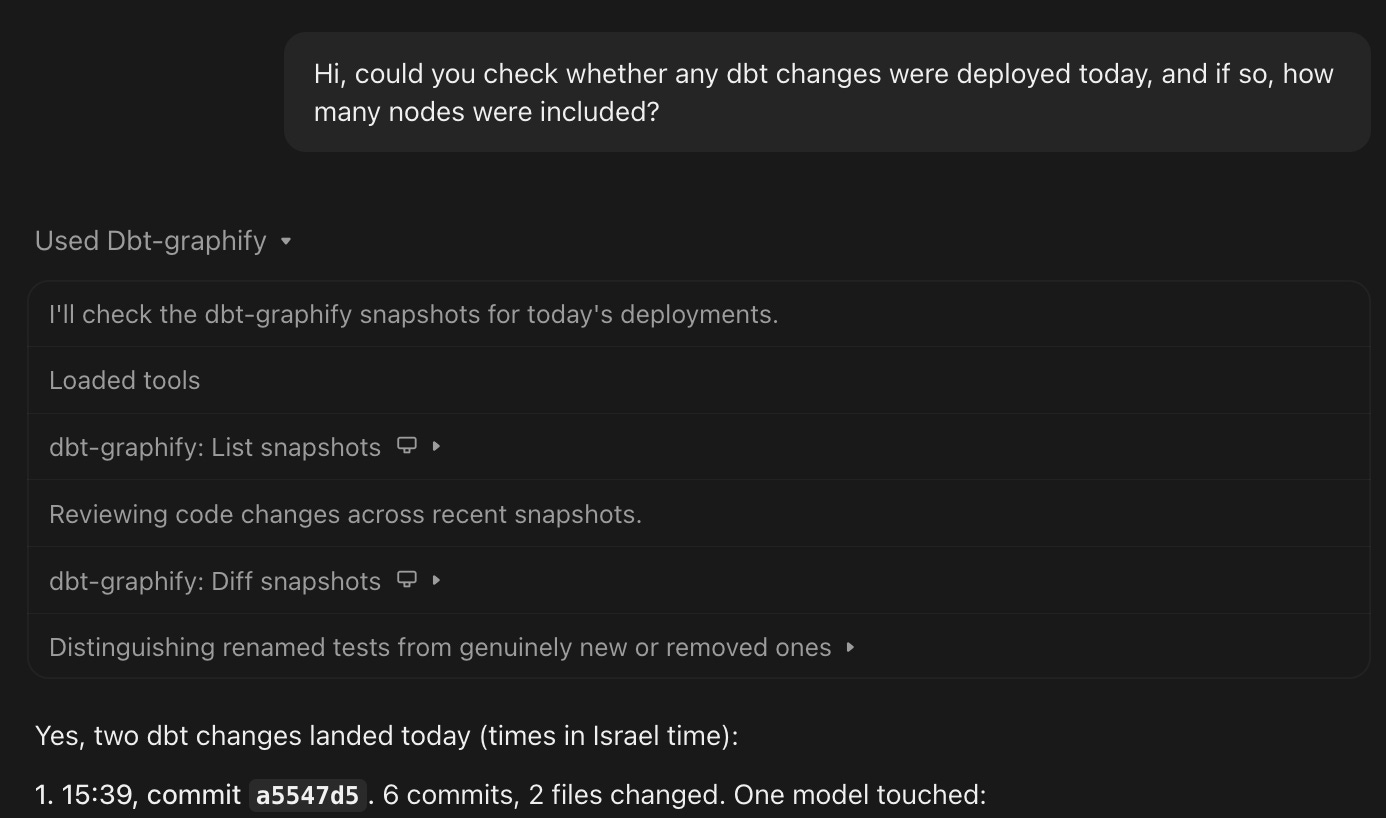
Claude listed the snapshots, diffed today’s against the previous ones, and answered with the commits, files, and models each deployment touched — from S3, not from anyone’s workspace.
That last part is the real reason to do it. Once the history lives in S3 and not in a Coder workspace, the thing asking the question doesn’t have to be a developer at all. It can be an agent triaging a failed run at 3am, starting from “what changed since the last good run?” before a person has opened a laptop.
You can already try it: the plugin marketplace
The MCP server is packaged as a Claude Code plugin, and the repo doubles as a plugin marketplace.
If you haven’t used Claude Code marketplaces, here’s how they work. A marketplace is just a git repo with a .claude-plugin/marketplace.json file — a catalog that lists plugins and where each one lives. Each plugin has its own .claude-plugin/plugin.json, which declares what it brings (here: an MCP server and a skill) and which settings it needs from you. Using one takes two steps: you add the marketplace, which only registers the catalog and installs nothing, and then you install the plugins you want from it.
/plugin marketplace add ponderedw/graphify-dbt
/plugin install dbt-graphify@ponder
On install, Claude Code asks where to install it (just you, or the whole project) and then for the plugin’s settings: the S3 path where CI uploads snapshots, an AWS key pair with read access to it, and the region. The keys are masked as you type and stored in your system’s credential store, not in a settings file. After that, the MCP server and the skill load in every session, and questions like the one in the screenshot just work.
It’s early — the CI side and the plugin are both still changing — so treat it as something to try, not something to build an incident process around yet. More on that once it’s settled.